-
-
Sign In
Create your Account
Breaking News
The Architecture of Ambition: 'The Rotoris Room' Redefines the Geometry of Modern Masculinity
New Kashmir, New Dawn: When PoK Merges with India, How Fast Will Its Fortune Change?
BREAKING NEWS: US STRIKES THIRD SHIP WITH INDIAN CREW NEAR OMAN; NEW DELHI LODGES STRONG PROTEST
First Reviews for Michael B. Jordan's First Post-Oscar Movie Are Not Kind
Swapped review – animated Netflix adventure plays like off-brand Pixar
Karan Johar to make Met Gala debut, Manish Malhotra to design ensemble
Samay Raina roasts Ranveer Allahbadia and Sunil Pal on ‘The Great Indian Kapil Show’
Riteish Deshmukh’s ‘Raja Shivaji’ beats Aamir Khan’s ‘Ek Din’ at box office on Day 1
‘Hokum’ Review: You Can Check In, but You Might Not Check Out
Won A National Award As A Teen, Worked With Aamir Khan, Then Quit Bollywood For Islam
Government officers, whether Central or State, belong to ECI during poll time, says Supreme Court
Days after rejig, NITI Aayog gets two new full-time members
AAP Rebel Sandeep Pathak Untraceable As Arrest Looms In Two Cases
'Good night, brother. Let's go to bed': Trump mocks Ilhan Omar over her marriage. She hits back
Iran President Wants To Sack Foreign Minister Amid US Talks? What Report Said
AAP govt. wins confidence motion in Punjab Assembly
‘Glory’ series review: Karan Anshuman shines light on the darkness around the Olympic dream
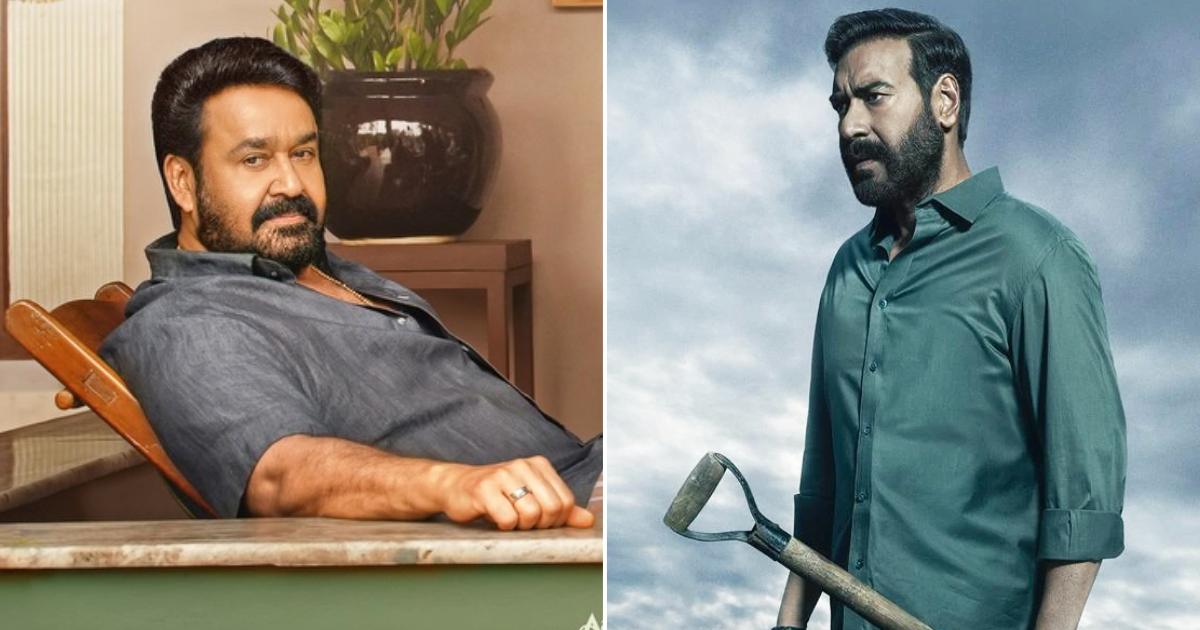
Patriot Review: Mammootty And Mohanlal Deliver A Masterclass In Acting
AppYash's Toxic Skips June 4 Release, To Hit Theatres On A 'Globally Aligned Date'
3 uncomplicated ChatGPT prompts to create ‘meet your younger self’ viral Instagram trend pics
This Australian minister is a big Shah Rukh Khan fan—‘Om Shanti Om is my all-time favourite’
‘The Boys’ Season 5, Episode 5 Release Time: Here’s When Episode 5 Drops On Prime Video
CBI To Probe Rs 397 Crore Contract Issued Under DMK's Senthil Balaji
BJP Sweeps Gujarat Local Body Elections, Reinforces Its Political Dominance
Record 91% turnout in West Bengal’s phase two poll; total State turnout highest since Independence
UDF To Rout Pinarayi Vijayan-Led LDF After 10 Years In Kerala: Axis My India Exit Poll
Tamil Nadu election 2026: Greater Chennai, northern T.N. may shape poll results
4 Exit Polls Give BJP Edge In West Bengal, 2 To Trinamool Congress
Former Israeli PMs Bennett, Lapid unite to challenge Netanyahu in elections
TMC MP Saayoni Ghosh's speech with many faiths' prayers now viral: ‘BJP wants to divide us’
Arvind Kejriwal's Case and Why the Citizen Has the Right to Protest Against an Unfair Game
Darling 4K re-release opens to ₹7.59 crore, ranks second among Telugu re-releases
Sai Pallavi gets emotional at Ek Din event, apologises for poor Hindi.
Kashika Kapoor’s ‘Caste’ Gets a Massive Power Boost with Naga Babu
King arrives on Christmas, makers of SRK's film confirm release date with teaser
How rich is Raghav Chadha? A look at Rajya Sabha MP and Parineeti Chopra's husband's net worth
Inside Sehar Hone Ko Hai row: Trolls, tension, tiff surrounding actors Parth-Rishita
Laughter Chefs 3: Bharti Singh quashes rumours of the show going off-air
'Apex' review: Charlize Theron can't save this bland, empty thriller
'Prathichaya' Movie Review, Nivin Pauly's Unruly Journey Of Power, Legacy, Morality And Ambition
Prosthetic Leg, Burnt Lips And Face, Iran's Mojtaba May Need Plastic Surgery
US Confirms Talks With Iran, 2 Key Officials To Fly To Pak Tomorrow
Vance Heads For A Deal Do-Over, This Time With No One Across The Table
Vance Heads For A Deal Do-Over, This Time With No One Across The Table
Anatomy Of A Rebellion: How Raghav Chadha Led AAP Exodus
Bengal polls: Scattered clashes, assault on candidates mar phase-I voting; ECI seeks report
Inside ‘Lee Cronin’s The Mummy’: False Rumors, Real Grief, and the Scariest Monster of His Career
Ajith, Vijay, Rajinikanth, Trisha and Kollywood celebs vote across Tamil Nadu
Watch Aryan Khan lock into ‘joota churai’ showdown at best friend’s wedding
Haryanvi Actor Divyanka Sirohi Dies At 30 In Ghaziabad
Ranveer Singh moves to end Don 3 row with Farhan Akhtar, may return Rs 10 crore fee
‘Michael’ Review: A Jackson Biopic Leaves Too Much Unsaid
Trump Offering Iran 3 To 5 Days To Respond On Peace Talks Amid Extended Ceasefire Deadline: Report
Mallikarjun Kharge Gets Election Commission Notice For PM Modi "Terrorist" Remark
Parul Yadav turns heads in a ₹3 lakh Gauri & Nainika gown at INCA Awards night
Can’t rule out BJP getting two-thirds majority: Rajnath Singh
Dhurandhar 2 Bags Rs 155 Crore OTT Deal With JioHotstar, Release Likely After IPL 2026
Shah Rukh Khan’s King bags Rs 250 Cr distribution deal with Pen Marudhar: Report
‘Raja Shivaji’ trailer: Riteish Deshmukh as the valiant Maratha warrior battles the Mughals
‘Jawan’ director Atlee welcomes second child, a baby girl, with wife Priya
Unseen ‘Ramayana’ footage screened at CinemaCon, YouTuber predicts Oscar nominations for film
Nyrraa M Banerji to Host an Exclusive “Welcome to Bali” Getaway This July
Madras High Court dismisses Tamannaah Bhatia’s plea for ₹1-crore damages from Power Soaps
Bhooth Bangla Advance Booking: Akshay Kumar Film Sells Tickets Worth Rs 2.65 Crore
Jaishankar speaks to Israeli counterpart Gideon Sa'ar over ‘different aspects’ of West Asia crisis
A Missile On One Soldier's Shoulder Could Ground The US Air War In Iran
Omar refuses to cut inaugural ribbon in tricolour stripes, asks organisers to keep it with respect
Chanakya would've been shocked: Priyanka Gandhi to Amit Shah over women's quota
"Why Didn't You Sign It First?" Bangladesh PM To Opposition On July Charter
Sreeleela opens up on completing MBBS while being a busy actor
Bombay High Court to order takedown of content infringing personality rights of actor Kartik Aaryan
Coimbatore cable TV operator arrested for telecasting leaked footage of Jana Nayagan
Salman Khan Sends Message To Preity Zinta With Punjab Kings In Top 2 Among IPL 2026 Teams
Dhurandhar Shatters All Records: India’s First Rs 3,000 Crore Franchise Topples Baahubali & Pushpa
Ex-MP Cong MLA Bharti terms conviction 'politically motivated', accuses BJP leader of conspiracy
'We all love you', Trump tells PM Modi during 40-min call on Iran war, Hormuz
BJP leader Samrat Choudhary to be sworn in as Bihar Chief Minister tomorrow
West Bengal Assembly Elections 2026 | Darjeeling’s familiar faultlines
Putin Offers To Help Middle East Peace Efforts In Call With Iran President
Actress Taniyaa Chatterjee Claims Yuzvendra Chahal DM'd Her, Shares Instagram Messages
Who Is Juhi Bhatt? Actor-Content Creator Now Dating Ranveer Allahbadia
Ankita Lokhande to become a mother 4 years after marriage; baby bump spotted in viral video?
'The Super Mario Galaxy Movie' rockets to $629 million worldwide at the box office
Allu Arjun Dominates Raaka Salaries, Earns Nearly Eight Times More Than Deepika, Rashmika
AppVeteran Singer Asha Bhosle Hospitalised In Mumbai
US has begun clearing Hormuz: Trump as tensed Iran ceasefire talks underway in Pak
'Only They Can Play That Role': S Tharoor's Jab At Pak Over US-Iran Talks
AIMIM ends alliance with Humayun Kabir’s AJUP in West Bengal after viral video clip
‘Dacoit’ movie review: A simmering old-school romance led by Adivi Sesh and Mrunal Thakur
Systemic failure: Rajinikanth, Kamal Haasan denounce Jana Nayagan leak
'Kashmiri Crossfire Mein Hi Marte Hain': Samay Raina Trolls India's Got Latent Backlash
Deepika Padukone breaks silence on ‘Dhurandhar 2’, replies to trolls
‘Raaka’: Allu Arjun-Atlee movie gets a title; first look out
Congress Chief Mallikarjun Kharge "Regrets" Gujarat Remarks At Poll Rally
Iran's Mojtaba Orders Military To Stop Firing, But Warns "Not End Of War"
Trump says ‘a whole civilisation will die tonight’ if Iran does not make a deal
Trump threatens to jail reporters if they don’t turn over Iran source
Vijay-Rashmika Pick Black Suit, Silk And Glittery Gold For Kodagu Reception
Sushant Singh Rajput's Sister Reacts To His AI Pics: 'Nobody Can Play Rama As Beautifully As Bhai'
The Boys: Season 5 First Reviews: Butcher and the Gang Go Out with a Bang
“Work will be paid at dollar rates,” — Salman Khan’s response to those who insulted Rajpal Yadav.
Bollywood Actor and Producer Anoop Anmol Celebrates Milestone 70th Birthday
Chef Sanjeev Kapoor Had Denied To Accept The Padma Shri Award Until They Accepted His One Request
Karishma Tanna set to welcome her first child with husband Varun Bangera
‘Bhooth Bangla’ trailer: Priyadarshan and Akshay Kumar promise a nice blend of scare and laughs
Bengal Opinion Poll 2026: Mamata or BJP? Breathless Results in the Ultimate Survey for Power
Ajay Devgn bought this luxury van worth ₹1.6 crore; Shah Rukh and Hardik are also fans of this car.
With Pal Ye Mera, Kanish Sharma Brings His Cinematic World Into a More Personal Space
Awarapan 2 Release Update: Emraan Hashmi, Disha Patani Film Gets New Date
AI Reimagines Ranveer Singh As Lord Rama In Ramayana, Internet Says "Would Have Nailed It"
‘Maamla Legal Hai’ season 2 Series review: Ravi Kishan holds court with bizarre cases, bolder laughs
Dhurandhar 2: Why Pakistan President Asif Ali Zardari Still Can't Escape The 'Mr 10%' Tag
AAP launches full-blown attack on Raghav Chadha, BJP comes out in support
Rohan Ganotra’s Mysterious Look Sparks Buzz — Hint at Nasha or Just AI Magic?
Forces will take ‘unprecedented action’ if Pakistan attempts any misadventure, warns Rajnath
Need to continuously update public services to achieve goal of 'Viksit Bharat': PM Modi
AAP writes to Rajya Sabha Secretariat to remove Raghav Chadha as deputy leader
“Riteish Deshmukh’s Raja Shivaji Teaser Divides the Internet”
Vijay Sethupathi and Sai Pallavi to begin shooting for Mani Ratnam film in 2026? Find out
Vaccine billionaire buys $17.9m Raja Ravi Varma, setting new record for Indian painting at auction
Ranbir Kapoor Unveiled as Lord Rama in Trailer for Nitesh Tiwari’s Epic ‘Ramayana’
From TV to Bollywood: Meet Ishaan Kesarwani, India’s 5-Year-Old Superstar in the Making
After Tanhaji: The Unsung Warrior, Ajay Devgn And Om Raut Eye A Second Collaboration
Hans Zimmer Hits New Career Highs With An Unexpected Collaboration
Power shift? Iran military takes control of state functions, sidelines president Pezeshkian -
What do Trump's latest comments on leaving Nato mean for the alliance?
Andhra Chief Minister Lauds Passage Of Amaravati Bill In Lok Sabha
U.S. President Donald Trump’s address on Iran-Israel war: Key quotes
"Go Get Your Own Oil": Trump's Message To UK, Other Countries On Hormuz Strait
'Another Outsider': Trinamool Takes A Dig As Tennis Legend Moves To BJP
Why a major action sequence in Shah Rukh Khan's 'King' had to be shifted to a different location
Sonam Kapoor and Anand Ahuja become parents to a baby boy
Ravi Bishnoi trolls Babar Azam from the Rajasthan Royals training camp
Trump Says He Got 'Gift' From Iran's Ghalibaf, Hints At Kharg Seizure For Taking Oil
Nitish Kumar resigns from Bihar Legislative Council
AppMojtaba's New Message, Days After Trump's 'Don't Know If He's Alive' Claim
TVK president Vijay declares nearly ₹625 crore in assets and loans to family members
Assembly Elections highlights: Everyone working hard for BJP-NDA hat-trick in Assam, says PM Modi
In manifesto, DMK promises homemakers ₹8,000 coupon for buying home appliances of choice
Donald Trump says US could ‘take the oil in Iran’
Vijay follows in the footseteps of Tamil Nadu politicians with a penchant for dual contests
Congress fuelled infiltration, changed Assam’s demography: Amit Shah
Subramanian Swamy on Epstein Files, ‘bogus’ govt data, and the RSS
4 weeks in, Trump’s conflicting signals on Iran war frustrate GOP lawmakers and political allies
Imad Wasim’s ex-wife Sannia Ashfaq lashes out at his new wife
Aruna Irani, Farida Jalal reunite after 53 years since Rishi Kapoor’s Bobby
Shershaah director Vishnu Varadhan to helm Ekta Kapoor, Tanuj Garg's political thriller
‘Kaattaan’ review: Vijay Sethupathi’s dead man lives many lives in M Manikandan’s intriguing series
Mardaani 3' OTT: Watch Rani Mukerji's cop action thriller; date and platform revealed
Balendra Shah takes oath as Nepal’s Prime Minister
AIADMK names candidates for four constituencies in Thoothukudi and Kanniyakumari
TVK chief Vijay accuses Chennai police, officials of denying permission for his Perambur campaign
'Will Review Rates Every 15 Days': Centre After Petrol, Diesel Excise Cut
Opposition slams Centre’s fuel excise cut as poll gambit; BJP defends relief for oil firms
'Ludicrous': US defence expert ridicules Pak's mediation role in Iran war, pitches India
Jaishankar defends India’s stand as Opposition targets govt. on ‘Pak. mediation’ in West Asia
No songs like Shararat in Dhurandhar 2: Choreographer Vijay Ganguly explains why
‘Project Hail Mary’: Ryan Gosling soars in this heartfelt tale of interstellar friendship
In pictures: SS Rajamouli creates miniature Varanasi city for new film
‘The Furious’ trailer: Xie Miao, Joe Taslim lead this Hong Kong action film
First trailer for Harry Potter TV series reveals much-anticipated new take
‘Follower’: How Harshad Nalawade’s Kannada-Marathi film confronts border tensions and digital hate
Kim Jong Un uses Iran war to justify North Korea’s decision to keep its nuclear weapons
Did PM Modi mention a Covid-like lockdown in his speech? Fact-checking the viral claim
Behind-the-Scenes Glimpse: Javed Khan’s Intense Preparation for Offline Proves His Dedication
Except West Bengal, SIR Took Place Smoothly In Other States: Supreme Court
'Lockdown in India' among top searches today. Reason: Covid memories, Iran war
Dhurandhar's SP Chaudhary Aslam Was A Sanjay Dutt Fan, People Called Him 'Baba Cop'
Dhurandhar 2 Casting Director Mukesh Chhabra Breaks Silence On Dhurandhar 3 Rumours
Khushi Kapoor and the night a simple outing became a viral argument
Badshah Marries Punjabi Actress Isha Rikhi In Intimate Wedding Ceremony
Daredevil: Born Again season 2 release time and episode schedule
Madras HC directs filmmaker Gautham Menon to refund ₹4.25 crore to financier over unmade film
Kerala Assembly Elections 2026: BJP seal on Election Commission of India letter sparks row in State
Energy, water, bonds: What are Iran’s targets if Trump hits power plants?
A Covid Reminder In PM Modi's Rundown Of Middle East War Impact On India
EC to publish first supplementary voters list today under SIR of electoral rolls in West Bengal
Politics on Id in West Bengal: Mamata targets Modi; Suvendu pushes Hindutva agenda
"Glad He's Dead": Trump On Death Of Ex-FBI Head Who Probed Russia Ties
Danish Iqbal on playing Dawood Ibrahim in 'Dhurandhar': Didn't know that my character was Bade Sahab
‘Peaky Blinders: The Immortal Man’: Cillian Murphy’s Tommy Shelby returns for one last hurrah
‘Dhurandhar The Revenge’: Ranveer Singh’s actioner opens big, crosses Rs 200 crore at the box office
Chuck Norris Dies At 86: Fans Celebrate His Legacy With Iconic Memes
No clandestine activities in Canada linked to Indian government: Police chief
Iran war: What is happening on day 21 of US-Israel attacks?
Japan's Takaichi tries to reaffirm alliance with Trump as he seeks help securing Strait of Hormuz
West Bengal Assembly polls: BJP announces second list of candidates
At 41, Divyanka Tripathi’s Baby Bump Photos Spark Buzz Doctors Share Reality of 40s Pregnancy
At 41, Divyanka Tripathi’s Baby Bump Photos Spark Buzz — Doctors Share Reality of 40s Pregnancy
Review: Pawan Kalyan’s Ustaad Bhagat Singh – A mixed bag with fan appeal
‘Dhurandhar: The Revenge’ movie review: A loud, violent spectacle that forgets to breathe
“Supertech Resolution: Supreme Court Roadmap and IRP-Led Process Bring Hope for Homebuyers”
'Project Hail Mary' Review: Ryan Gosling's Sci-Fi Epic Is the First Great Film of 2026
Trump confirms meeting with China’s Xi Jinping delayed as war on Iran rages
Tamil Nadu Polls: ECI Confirms EPIC Valid Statewide for Registered Voters
Lahore Court Orders Closure of NAB Investigation Against Maryam and Nawaz in Sugar Mills Case
Assam MP Explains Why He Left Congress, Remembers Encounter With Shashi Tharoor
Trump Asserts U.S. Doesn’t Require Allies’ Support Against Iran
Varun Gandhi Meets PM Modi with Family: Is His Political ‘Exile’ Coming to an End Soon?
Cannot Support Iran War In Good Conscience": Top Trump Official Resigns
How to Watch Tata IPL 2026 Live in HD Quality For Free
Strict Action Ordered: CBFC Directed to Remove Nora Fatehi’s Song ‘Sarke Chunar’ from All Platforms
‘Dhurandhar: The Revenge’ Crosses 10 Lakh Domestic Ticket Sales Before Release
Hard Rock International announces closure of 10 outlets in India, including three in Bengaluru
"Controversy Over Badshah, But Why No Questions on Nora Fatehi’s Song? Crossing All Limits"
RGV Returning to the Sarkar Universe with the Bachchan Duo?
RGV Returning to the Sarkar Universe with the Bachchan Duo?
Assembly Elections 2026: Can You Vote Without A Voter ID? Check Valid Alternatives
Assembly Elections 2026: Can You Vote Without A Voter ID? Check Valid Alternatives
"'If Not Nitish…' Anant Singh Announces Retirement from Electoral Politics, Plans to Field Son"
Netanyahu's Video Proof Of Being Alive Hits A "Disappearing" Ring Problem
All five NDA candidates win Rajya Sabha polls in Bihar, including CM Nitish Kumar and Nitin Nabin
Trump aide Laura Loomer apologises for controversial ‘anti-India’ social media posts
India releases Ladakh activist Sonam Wangchuk after six months in jail
Karan Aujla Concert Causes Massive Traffic Jam in Mohali, Commuters Face Long Delays
Actor Madhu Malhotra of Hero and Satte Pe Satta Dies at 71
Chris Hemsworth Admits Ditching Hollywood for His Native Australia Was ‘Greatest Decision’ He’s Made
Rapper Santy Sharma Defends Badshah Amid ‘Tateeree’ Song Lyrics Controversy
PM Modi speaks to Iranian President, discusses 'serious' situation in West Asia
BJP-backed panel sweeps Panaji municipal corporation polls, wins 27 of 30 seats
PM Modi Unveils Rs 19,680 Crore Projects, Hands Land Pattas To Assam Tea Workers
Krishna Gautam Preps with MMA Training for Her Fierce Role in Forest Ranger
PM Launches and Dedicates ₹11,000 Crore Worth of Development Projects in Ernakulam, Kerala
Mojtaba Khamenei Secures Elite NOPO Protection — Inside Iran’s ‘Black‑Clad’ Guard Unit
One Piece’ Season 2 Review: A Swashbuckling Adventure Packed with Gum-Gum Fun Across the Grand Line
Vaibhav Suryavanshi: ‘Toofan’ Returns! Teasing Fans with a Glimpse of the Upcoming Action
Hansika Motwani and Sohael Khaturiya Divorce After 4 Years; Actor Declines Alimony, Says Lawyer
Enhypen Member Heeseung To Depart K-pop Group and Remain Under Label As Soloist
One Piece Season 2 releases today: Release time in India, where to watch and episode details
BJP Fact-Checks Mamata Banerjee’s ‘President Standing’ Photo Claim Targeting PM
US Would Need Large Ground Force to Capture Iran’s Highly Enriched Uranium, Sources Say
PM Modi Congratulates Balen Shah, Says India–Nepal Relations Will Soar Higher
Opposition Drops Om Birla Trust Vote, Targets Centre Over Iran War and Oil Price Shock
Mojtaba Khamenei Takes Over, But Iran’s Power Is No Longer Held by One Man
Shreya Ghoshal on being called ‘successor’ to Lata Mangeshkar: ‘I enjoy the tag’
Krithi Shetty nails her elegant black look, makes fans go gaga over her beauty
Avatar: The Last Airbender Creator Confirms New Movie Is Finished: “It’s Done, It’s Awesome”
Iconic OG Welcome Characters Dr Ghungroo, Majnu Bhai Set To Return As Makers Begin Work On Welcome 4
MasterChef India 9: Nagpur brothers Ajinkya, Vikram Gandhe take home the trophy
Beast Mode On’: Ranveer Singh Returns as Hamza in Intense ‘Dhurandhar 2’ Trailer
Who Will Succeed Nitish Kumar? Samrat Chaudhary Among Six Leading Contenders
All India Trinamool Congress to Back No-Confidence Motion Against Om Birla: Party Sources
Israel’s “Blue Sparrow” Missile from Near‑Space Strikes Iran, Killing Khamenei
Ex-US Envoy Taranjit Singh Sandhu Is New Lt Governor Of Delhi
Trump Signals He’ll Target Cuba After Concluding Iran Campaign
Nepal Election Update: PM Contender Balendra Shah Expands Lead as RSP Tops 101 Seats
The Boys’ Season 5 trailer: Homelander eyes immortality in finale
Hello Bachhon’ Review: Viineet Kumar Siingh’s Passion Lost in TVF’s Formulaic Snoozefest
Yash's New Film Sparks Debate: Viral Letterboxd Synopsis Divides Fans Online
Dua Lipa celebrates father’s birthday with heartwarming tribute
Ranveer Singh Unveils 'Dhurandhar The Revenge' Trailer Date & Time: Warns Fans, "Brace Yourself"
Zendaya and Tom Holland secretly married, says stylist Law Roach: “You missed it”
France, Germany, United Kingdom consider potential strikes on Iranian missile launchers
With sniper rifle images, Kim Jong Un draws focus to daughter seen as potential successor
Missile attacks continue and Iran’s leadership remains defiant after Khamenei
Who Will Be Iran's Next Leader? A Look At Khamenei's Possible Successors
Delhi Traffic Police Releases Advisory Ahead of Karan Aujla’s P-Pop Culture India Tour Concert
Yadavji Ki Love Story: Vishaal Mohan says "No one wants their film to embroil in any controversy"
10 things you need to know about Tomorrowland Thailand Discover how to access
The Reason Rashmika Mandanna Carried a Coconut as She Walked Down the Aisle With Vijay Deverakonda
India and Israel Commit to Strengthening Strategic Partnership in Defence and Technology
Bihar IG Arrest Drama: Patna Reached by Andhra Police Without Warrant; Court Rejects Transit Remand
8th Grade Syllabus to Be Revised in Bihar Schools; Education Minister Sunil Kumar Shares Key Details
Star Plus confirms launch date of its newest show ‘Taara’
Prime Minister Narendra Modi Clicks Selfie With Fauda Cast During Israel Visit
Vijay Deverakonda, Rashmika Mandanna are officially married
Sholay's Darkest Secret: How a Real-Life Bandit Defined Bollywood's Greatest Villain.
The Secret History of the Big B: When Amitabh Bachchan Was a Real-Life Miner
Pakistan’s qualification depends on others; today is a do-or-die clash for Sri Lanka vs New Zealand.
Storm Strikes US: 11,000 Flights Canceled, 500,000 Homes Lose Power
Subedaar’ Trailer: Anil Kapoor Goes Vengeful in Suresh Triveni’s High-Octane Army Actioner
The 50 Elimination Episode 24: Eviction Update & Vanshaj Singh’s Wildcard Comeback?
Who’s Mayank Pawar? Splitsvilla 7 fame and fitness coach who passes away at 37
PM Calls AI Summit a Game-Changer for Technology
Philippine Vice President Duterte to run for president in 2028 elections
Meghalaya MP Ricky Syngkon Passes Away After Collapsing During Futsal Match
After Revolting Over Ticket Denial, Vinod Jakhar Now Entrusted with NSUI Leadership
‘Don’t Know Why It’s Being Criticised’: Emmanuel Macron Defends India’s Rafale Deal
‘You’re My Best Gift This Year’: Mahieka Sharma Responds to Hardik Pandya’s Sweet Birthday Wish
Eric Dane, ‘Grey’s Anatomy’ and ‘Euphoria’ Star, Passes Away at 53 After ALS Battle
Toxic’ Teaser Out: Yash Unleashes Mass Avatar in Geetu Mohandas’ Stylish Actioner
India 60/2 vs Netherlands: Varma and Kishan Lead the Fightback
Is Ishan Kishan Getting Married? Cricketer’s Mother Addresses Aditi Hundia Rumors
Border 2 Day 26: Sunny Deol’s Film Holds Strong in Week 4, Collects ₹91 Lakh
Shahid Kapoor’s ‘O’Romeo’ Nears ₹50 Crore Milestone at Domestic Box Office
Salman Khan’s Father Salim Khan Hospitalised, Placed on Ventilator Support: Health Update on Veteran
Pravina Deshpande, Who Shared Screen Space With Salman Khan in ‘Ready,’ Dies at 60
Sidharth Malhotra’s Father Sunil Malhotra Passes Away; Actor Rushes to Delhi to Be With Family
Raj Ranjit to share screen with Madirakshi Mundle, famed as Sita in TV show 'Siya Ke Ram'
Dadasaheb Phalke: The Legend Who Shaped Indian Film History
Jackie Shroff’s Organic Farm Life: Inside His Eco-Friendly Lifestyle and What It Really Costs
"From Empty Pockets to the Disco King: The Heartbreaking Struggle of Mithun Chakraborty."
A-Lister Zen: Why Celebs Like Sara Ali Khan Swear by Yoga for Sanity
Faith & Devotion: Kashika Kapoor’s Temple Visit This Mahashivratri
Nagabandham Teaser Preview: Telugu Media Goes Berserk Over This Technical Marvel
Nagabandham Teaser Preview: Telugu Media Goes Berserk Over This Technical Marvel
Sherni Nikki Tamboli’ Trends on Twitter as Nikki Dominates the 50 Show with Fierce Gameplay
Gullu is a WEAK Player!" Anuska Ghosh Slams Co-Star, Says Splitsvilla X6 Isn't Roadies Double Cross
Chemistry That Kills: Adarsh Gourav and Shanaya Kapoor Shine in ‘Tu Yaa Main’
Chemistry That Kills: Adarsh Gourav and Shanaya Kapoor Shine in ‘Tu Yaa Main’
A Masterclass in Elegance: Isha Ambani Commands Attention in Champagne-Gold and Pastel Pink
O’ Romeo Review: A Beautifully Shot Boredom with a Great Lead Performance
Ranveer Singh’s 'Dhurandhar' Hits Pakistan’s Grey Market: You Won’t Believe the Pirated Price Tag
Triptii Dimri Sheds the Soft Girl Image in O’ Romeo, Pivots by Performing Action Stints
Why Did Amitabh Bachchan Take a Break from Acting in the 1990s?
Mogambo Khush Hua: How Amrish Puri’s Baritone Still Rules Your Timeline
The Catchy: "Glow Like Malaika: The Ultimate Morning Detox Water
Tina Ambani's Journey From Silver Screen to the Corporate World
Inside Jacqueline Fernandez’s IF Routine: The Secret to Her Energy and Glow"
How Sunil Dutt Saved Nargis from a Fire on the Sets of Mother India
The Venus of the Silver Screen: A Tale of Eternal Beauty and Unfinished Love
Sherni Nikki Tamboli’ Trends on Twitter as Nikki Dominates the 50 Show with Fierce Gameplay
Sana Raees Khan Secures Landmark Personality Rights Protection for Vivek Oberoi in Delhi High Court
Rising Star Anusmriti Sarkar Steals the Spotlight, Wins Big at Heartwarming NGO Event
Beyond the "Khush Hua": The Gentle Soul Behind Cinema’s Greatest Villain
Hard Work Pays Off: Dharmendra’s First Paycheck Was Only ₹51
The Kay Beauty Phenomenon: How Katrina Kaif Built a ₹350 Cr Makeup Empire."
The Alia Edit: Why Internal Happiness is the Ultimate Glow-Up
Kader Khan: More Than an Actor — The Legendary Dialogue King & Master Writer
Clean Eating, Clear Conscience: A Deep Dive into Mallika’s Vegan Mantra
Salman Khan: The Ultimate "Soap-erstar" and His Secret Collection.
Why Chetan Anand Refused to Cast Rajesh Khanna After He Became a Superstars"
Supreme Court Rejects Jan Suraaj Plea to Delay Bihar Bypolls: "No Ground for Interference"
Suryakumar Yadav Addresses Key Challenges Ahead of India’s T20 World Cup Opener
RCB’s Golden Run: Smriti Mandhana Proves ‘Ee Sala Cup Namdu’ is a Habit.
Vadh 2 Review: A silent execution of tension.
Chennai Drug Bust: Malayali Actress Anju Krishna and 7 Others Arrested with Meth & Ganja
Elvish Yadav & Jiya Shankar Engaged? The Real Reason Behind Their Sudden Commitment Revealed!
We Lived Like Husband and Wife": When Aditya Pancholi Addressed His Past with Kangana Ranaut
When AbRam Khan Thought Amitabh Bachchan Was His Real Grandfather
Gudgudi: Ahsaas Channa Stars in Casting Director Mukesh Chhabra’s Bolti Khidkiyaan- Poster Out Now
Bharat Taxi Debuts Today: A New Challenger for Uber and Ola
"Living Dead’ on the Ballot: Kamal Haasan Slams Bihar’s Voter List Chaos"
BJP: Sikh Community Outraged by Rahul Gandhi’s "Traitor" Remark Against Bittu
Finish Dinner by 6:30 PM? The Secret Behind Akshay Kumar’s Ageless Fitness
The 'Guru' of Bollywood: Why Nobody Does Character Arcs Like Abhishek
The Truth Behind Abhishek Bachchan and Aishwarya Rai’s Fairytale Wedding
Actor Rajpal Yadav Must Surrender, Rules Delhi High Court in Financial Dispute
Woman Asks Delivery Agent To Bring Food Inside Graveyard, Internet Calls It "Scripted"
Salman Khan to Appear as ‘Bade Sahab’ in Dhurandhar 2?
Air India and IndiGo planes COLLIDE into each other at Mumbai Airport with passengers inside
India’s Nipah Outbreak Triggers Regional Health Alerts Across Asia
Trump Cuts Tariffs on Indian Imports from 25% to 18%
The Bollywood Superstar Who Was Rejected 100+ Times Before One Film Changed Everything
A massive blaze at Ranchi’s Khadgarha terminal reduced 6 buses to ashes within minutes.
Independence Day 2026 Gets Explosive: John Abraham & Rohit Shetty’s Maria IPS Set for Big Clash
Ajmer’s Sufiya Sufi Creates History, Smashes Guinness World Record With 98.2-Hour Manali–Leh Run
Is the mystery over? Massive Dhurandhar 2 leak points to the real Bade Saab. Fans are losing it.
Rejected for his looks, now he rules the world: The SRK Story you didn't know!"
New OTT releases to watch this weekend: 8 new movies and shows on JioHotstar, Netflix and more
Outrage Erupts After Ram Charan’s Daughter is Mobbed During Hospital Visit to Meet Newborn Twins."
Lawrence Bishnoi Gang Issues Chilling 'Wait and Watch' Warning After Rohit Shetty House Firing
SS Rajamouli’s ‘Varanasi’ Locks Official Release Date; New Poster Sparks Global Hype
Team India Offers Prayers at Padmanabhaswamy Temple Thiruvananthapuram
Nawazuddin Siddiqui's Long Road to Manjhi A 12-Year Journey from the Background 100 to the Spotlight
Virat Kohli’s Instagram Goldmine: Here’s How Much King Kohli Earns Per Insta Post
SRK vs Sameer Wankhede: The Legal Battle Takes a New Turn.
Why the Writers Almost Fired the Greatest Villain in History.
Supreme Court Stays Ugc Regulations 2026, Flags Concerns Over Clarity
Delhi Police Woman Commando Brutally Murdered; Husband Bludgeons Her to Death with Dumbbell
UGC Equity Rule Protests Signal a New Phase in Hindutva’s Victimhood Politics
When is Jaya Ekadashi 2026? Know the Correct Date, Fasting Rules, and Best Time for Parana
Boys aged 10-14 GANG R@PE a minor 6-year-old girl in Delhi: Left to blefd and unable to walk
Rajat Dalal's Journey Over? Doctors Advise Retirement After Severe Triceps Tear in 'The 50'
"Papa, I'm Flying With Ajit Pawar": The Heartbreaking Final Words of a Crew Member to His Father
Delhi HC Bans AI-Generated Film Featuring Pawan Kalyan’s Son Over Privacy Concerns
Tragic Loss: Maharashtra Deputy CM Ajit Pawar Dies in Plane Crash
‘You Can’t Do This at 63’: Sunita Ahuja on Govinda Falling for Starlets ‘Looking for a Sugar Daddy’
Was Akshaye Khanna’s Cameo in Border 2 a Last-Minute Call After Dhurandhar’s Success? Makers Respond
Newly Raised Bhairav Battalion Roars at 2026 Republic Day Parade
IAF’s Sindoor Formation Roars Over Kartavya Path at 77th Republic Day
50 Stars, One Palace: Urvashi Dholakia & Karan Patel Join Farah Khan’s New Reality Series
Riz Ahmed Opens Up About His Secretive Project with Tom Cruise
JioHotstar’s 'Special Ops' S2 Crowned India’s #1 Show of 2025; Netflix Dominates Volume with 20 Hits
Tense Standoff Between Hardik Pandya and Murali Karthik During 2nd T20I Goes Viral
From Sacred Site to Global Icon: The Unprecedented Growth of Ayodhya
40 Years, 4 Milestones: How Betaab, Ghayal, Gadar, and Border 2 Define Sunny Deol
Abhijit Majumdar, 54-year-old Odia music composer, dies at AIIMS Bhubaneswar
Justice for Yash Dayal: RCB Pacer Granted Interim Relief from All Allegations
Anupam Kher Hits the Gym at 70; Fans React with Hilarious Comments to Viral Workout Photo.
Cheekatilo’ Review: Sobhita Dhulipala Shines, but the Script Only Flickers
Sonam Bajwa Breaks Silence on Attending Border 2 Events Alone, Without Diljit Dosanjh
The Mystery Behind Sridevi’s Final Film ‘Mom’
How AR Rahman Created ‘Vande Mataram’: A Musical Tribute to India
Salman Khan Honors Galwan Heroes in New Patriotic Anthem 'Maatrubhoomi'
Newborn Girl Found Dead In Garbage Bin Near Mumbai Airport!!
After Dhurandhar, Mukesh Chhabra Sets the Bar High with Casting for Border 2 and O Romeo
From Martial Arts Teacher to Movie Star: Akshay Kumar’s Accidental Debut
Beyond the Visuals: The Untold Story of Baahubali’s Hindi Dubbing
"Going to school, beta?" Axar Patel’s Brutal Roast of Shivam Dube’s New Haircut Goes Viral
Anushka Sharma Rumored to Buy 3% Stake in Royal Challengers Bengaluru!
"Beyond the Screen: The Secret Behind Raj Kapoor’s All-White Wardrobe"
Blink and You’ll Miss Him: Every Time Subhash Ghai Snuck Into His Own Movies
The Mayor Race Equation: MNS Pivot Aids Mahayuti While Internal Feuds Haunt Major Parties
Snow Blankets the Sahara: The Science Behind This Rare Phenomenon
Netflix Outlook Underwhelms: Stock Slides on Slower Growth Fears.
10-year-old girl fulfils her dream of marrying childhood boyfriend 12 days before dy!ng of leukemia
In Bollywood, the actor most widely credited with playing the highest number of double roles
The Price of Perfection: Madhubala’s Health Struggle During Mughal-e-Azam
Inside Ramoji Film City: Fascinating Facts About the World’s Largest Film City
Why did Nana Patekar Walk Out of Shahid Kapoor’s ‘O Romeo’ Launch?
Border 2 Gets U/A 13+ Certificate: No Cuts, CBFC Clean Chit, and Official Runtime Revealed
Market Turmoil: Global Stocks Sink, Gold Hits All-Time High Amid Trump-Greenland Trade Standoff
NASA Veteran Sunita Williams Retires After Spending 608 Days Beyond Earth
The End of an Era: Saina Nehwal Bids Farewell to the Court
Who Is Nitin Nabin? BJP Names 45-Year-Old Leader as Its 12th National President
"New 'North American' Map Shared by Trump Includes Canada and Greenland"
"Don't Fuel Terror": Jaishankar Delivers Blunt Warning to Poland Over Pakistan Ties
Decoding Budget 2026: 10 Terms That Define Your Money This Year
"Karnataka Govt Suspends Top Cop K. Ramachandra Rao Amid Viral Video Allegations"
REAL LIFE HERO: Akshay Kumar Jumps Out to Help Victims After Convoy Crash
The Real Reason Border (1997) Featured Actual Indian Army Tanks
From Khalnayak to Convict: The Untold Story of the Night Sanju Baba Was Taken.
Inside the KKR Camp: Harshit Rana Recalls Virat Kohli’s Special Request
“Inside Vicky Kaushal’s Intense Preparation for ‘Uri: The Surgical Strike’”
Mehbooba Mufti Backs A.R. Rahman Over ‘Communal Bias’ Claims in Bollywood
BCCL Shares Skyrocket on Debut: Lists at 97% Premium Over Issue Price
Director Kumar Neeraj’s ‘Shelter Home’ cleared by Censor Board, to release on February 20
The Suryakumar Yadav Controversy: Why Actress Khushi Mukherjee Is Facing a ₹100 Crore Lawsuit
Happy Patel Box Office Day 1: Vir Das' Directorial Debut Opens with ₹1.25 Crore
Virat Kohli and Anushka Sharma Acquire 5.1-Acre Land in Alibaug for ₹38 Crore
Why 'sholay' was a flop in the first two weeks?
India’s Squad SHUFFLE! Shreyas Iyer & Ravi Bishnoi RECALLED vs New Zealand
X (formerly Twitter) Hit by Massive Global Outage; Cloudflare Issues Suspected
Valentine’s Day Vows? The Truth Behind the Dhanush & Mrunal Thakur Wedding Rumors
"Washington Sundar ruled out of T20I series against New Zealand."
"Saffron Sweep in Mumbai: BJP Ends Decades of Thackeray Dominance in BMC"
₹7 Blood Tests & ₹25 ECGs: Khan Sir Disrupts Healthcare Costs in Bihar
BMC Results Live: BJP Alliance Surges Ahead Of Thackerays In Early Leads
Dhanush’s next feature film titled ‘Kara’, to be directed by ‘Por Thozhil’ helmer Vignesh Raja
BMC Elections: Exit Polls Project Decisive Victory for BJP-Led Alliance
"1-Hour 53-Minute Film Creates a Sensation on Netflix; Mind-Bending Plot Earns 7.1 IMDb Rating"
SEC Denies ‘Erasable Ink’ Claims in BMC Polls; Issues Clarification Amid Opposition Outcry
"The Day Dev Anand Was Forced to Wait at Amitabh Bachchan’s Gates"
"MEA Advises Indian Citizens to Depart Iran Following Regional Escalation"
Euphoria Season 3: First Look at the Dark Side of Adulthood
Taskaree Review: A High-Stakes Game of Cat-and-Mouse That’s Stuck in Park.
The Ultimate Glow-Up: How Rekha Rewrote the Rules of Stardom
First-Ever Face-Off: Emraan Hashmi vs Sharad Kelkar in Taskaree
News Flash: The Secret Behind Salman’s Lucky Charm
This actor has never portrayed a villainous character in Bollywood
A 'Dhurandhar' Twist to Mehendi: Why Akshaye Khanna Is Taking Over Palm Designs.
India Takes the Helm: S. Jaishankar Unveils BRICS 2026 Logo and Theme
Emraan Hashmi Critiques Industry Insecurity and the Rise of the "Hypermasculine" Hero
The Risky Bet: Why Every Producer Said "No" to Lagaan
Gabbar’s New Innings: Shikhar Dhawan Announces Engagement to Irish Partner Sophie Shine
Rani Mukerji is Back! ‘Mardaani 3’ Trailer Showcases a Brutal Fight Against Child Predators
The King’s Empty Plate: Why SRK Avoids Eating on Camera
Golden Globes 2026: the full list of winners
Delhi Shivers at 3°C as Icy Winds from the Himalayas Unleash "Winter Torture"
Heritage Meets Progress: PM Modi Leads Somnath Swabhiman Parv; To Unveil Major Projects in Gujarat.
"Rohit Can’t Keep a Straight Face! Virat Kohli’s Hilarious Impression of Arshdeep Singh Goes Viral"
"New Year Bonanza: Indian Railways Launches 122 New Trains; Hundreds of Routes to Get Faster"
Shubman Gill Breaks Silence: "I Respect the Selectors' Decision"
New Jamabandi Rules in Bihar: Farmers at Risk of Being Excluded from PM-Kisan Scheme
Justice Varma vs. Inquiry Committee: SC Reserves Judgment
Kashika Kapoor Begins the Year with Intent, Wellness, and Quiet Power at Atmantan
Ladakh Talks: Union Ministry to Convene High-Powered Committee Meeting in Late January
"Nina Dobrev Redefines Glamour in a Sculptural Off-the-Shoulder Gown"
"Kriti Sanon and Varun Sharma’s High-Octane Performance Steals the Show at Sanon-Ben Sangeet"
"Hrithik Roshan’s Battle with Scoliosis: Everything You Need to Know About This Condition"
"Sivakarthikeyan Addresses Parasakthi Censorship Row; Extends Best Wishes to Vijay’s Jana Nayagan"
The Raja Saab Review: Prabhas Shines in a Polarizing Horror-Comedy Spectacle
Anil Agarwal shared the heartbreaking news of the passing of his eldest son
From Cannes Buzz to Big Screens: Viral Star Ruchi Gujjar Sets Sights on Major Films in 2026
Massive Revision in UP: 2.89 Crore Voters Struck Off Draft List
The Powerhouse Duo: Rukmini Vasanth joins Yash in ‘Toxic’; First-Look Poster revealed.
Is Kuldeep Yadav Marrying a Bollywood Star? The Spinner Finally Responds
"More Than Just a Song": Medha Rana’s Heartfelt Tribute to 'Ghar Kab Aaoge' Ahead of Border 2 Debut
New Excise Overhaul: Rising Cigarette Taxes Risk Surge in Smuggling.
India Issues Travel Advisory for Iran Amid Rising Tensions
Leadership Shift at The Lallantop: Saurabh Dwivedi to Depart India Today Group After 12 Years
Deepika Padukone at 40: The Secrets Behind Her Ageless Fitness and Glow
The Geopolitics of Venezuelan Oil: U.S. Influence and Global Market Dynamics
Massive Turnout: 11,000 Devotees Gather for Grand Satyanarayan Katha at Bageshwar Dham
MSG Trailer: Mega Star Chiranjeevi Returns with Peak Swag!
MTV Splitsvilla 13 Winner Jay Dudhane Held in ₹4.61 Crore Fraud Case
"TV Couple Jay Bhanushali and Mahhi Vij Part Ways, Citing Desire for Peace"
The Last Stand: Fan Frenzy Erupts as Trailer Drops for Vijay’s Final Film, ‘Jana Nayagan’
FLASHPOINT: U.S. Military Initiates Operations in Venezuela
Dhurandhar Becomes the FIRST Bollywood Film to have a FULL Soundtrack on Spotify Global Top 200
Dhanush: A Masterclass Performer's Deep Dive into Love Stories with Tragic Depths
WHY B62 STUDIOS' BACK-TO-BACK GAMBLE CHANGES EVERYTHING
Salman Khan Compliments Tamannaah Bhatia’s Voice, Calls it ‘the most amazing voice ever
CR7's Abu Dhabi EXPLOSION: GOAT Unleashes ICONIC 'SIUUU' in Electric Clash vs. Al Wahda
Aditya Dhar Blends Four Global Action Styles to Create a New Language of Violence in Dhurandhar
Dhurandhar Breaks Records: Why This 2025 Blockbuster Is a Game-Changer
Screen Presence to Screen Power
Dhanush, Shahid Kapoor to Aditya Roy Kapur
Nitesh Tiwari to Om Raut: Directors Who’re Creating Larger-Than-Life Spectacles
1 Year of Singham Again - Arjun Kapoor and Rohit Shetty’s Bond Shines Through
Five Times Bollywood Reimagined Folk Songs Into Modern Anthems
Pooja Hegde, Triptii Dimri to Bhumi Pednekar: TOP 5 Self-Made Stars Redefining Bollywood Success
Alia Bhatt, Triptii Dimri to Mrunal Thakur: Actresses Redefining Feminism On-Screen
Haq: The Landmark Case That Redefined Justice and Still Divides a Nation
Teaser in Cinemas with Homebound this Friday
Fatima Sana Shaikh Captures Her Vietnam Trip in a Series of Pictures, Serves Pure Travel Goals
Shimmers to Pastels: THESE Top 7 B-town Ladies Show How to Stun in Sarees
Arjun Kapoor Handles it all With a Smile in New Ad
Arjun Kapoor dishes out sass for desserts
Nyrraa M Banerji Graces SIIMA Awards 2025, Balancing Glamour with Professional Milestones
Sherlyn Chopra Buys Luxurious Second Home in Juhu, Focuses on Work and Wellness
Urvashi Rautela, Global Superstar, won Fans’ Favourite award at the Prestigious GAMA Awards in Dubai
7 years of Love Sonia! A film that truly changed the game for Mrunal Thakur
When humanity calls, music answer
A Star in the Making: Vishakha Pandey’s Journey from Teacher’s Desk to T-Series Sets
S. Jaishankar reviews bilateral ties with Singapore's top leadership.
UP govt makes special preparations at Kashi Vishwanath Dham for first Monday of Shravan
In two separate incidents in Haridwar, the SDRF prevents the drowning of six Kanwariyas.
On July 16, Mamata Banerjee will lead a rally in Kolkata over the issue of migrant harassment.
Delhi Police discover the body of Sneha Debnath, a missing DU student, in the Yamuna River.
Bridge collapse in Gujarat: Mahisagar River search for lone missing person continues
The important plot twist in Kireeti Reddy's Junior is held by Genelia Deshmukh.
Unveiling the Ramayana movie poster: Yash's Ravana and Ranbir Kapoor's Lord Ram square off
A man was detained for using a video to make offensive comments about PM Modi and CM Yogi.
Nitin Gadkari provides leadership jabs and cautions against vanity in positions of authority.
Key facts for Shafali Verma's 11th half-century in WT20Is
Updates on the 5th T20I match between India Women and England Women in real time
What was discovered in the Air India flight accident investigation and how does a black box operate?
Today is a bank holiday: Are banks open or closed on July 12th, Saturday? Look here.
Don't Jump To Conclusions": Aviation Minister On Air India Crash Report
Ajay Devgn Returns with Double the Funjabi Madness In Son Of Sardaar 2! Watch The Trailer Now
Early trading saw a drop in markets due to selling pressure in IT equities.
How can Italy make it to their first international competition in the 2026 T20 World Cup?
On Friday, YEIDA will conduct a draw for the residential plot scheme in Sector 18.
Manipur's crackdown against Arambai Tenggol gets more intense
Who is Priya Nair, Hindustan Unilever's first female CEO and MD?
IREDA share price: Following Q1 2025 earnings, Navratna PSU stock falls 4%. A chance to purchase?
Hints and answers for July 11, 2025, on NYT Connections
Following the earthquake, Delhi Metro trains pause for two to three minutes.
Priya Nair succeeds Rohit Jawa as the first female CEO and MD of Hindustan Unilever.
World No. 1 Aryna Sabalenka Knocked Out By Amanda Anisimova In Wimbledon Semi-final
Police carelessness in a 2007 murder case is criticized by a Delhi court as "dereliction of duty."
The Supreme Court concerns the timing of the amendment of the Bihar voters list. Why can not it be?
Who is Assam's viral mystery girl?
Real Madrid vs. PSG: Live Club World Cup semi-final
Men's record 14th Wimbledon semifinal for Novak Djokovic
Telangana: CM invites KCR to discuss irrigation projects and water use in the Krishna and Godavari
Namibia will implement a digital payment system modeled after India's UPI.
After the most recent FOMC reduction, is Jerome Powell stepping down? This is the reality.
Donald Trump levies a 30% US tax on Sri Lanka and sends letters to seven nations.
Top 10 trending hashtags on instagram
know interesting facts about lububu dolls
Ajith Kumar takes motorcycle riders on a thrilling journey across Bulgaria and Romania. Watch
Embeth Davidtz drew on her childhood in Africa to adapt Alexandra Fuller’s memoir
In an X post, Martina Navratilova explains why she was sent away from the Wimbledon cafe.
A climate group that had previously targeted the Apple store trashed the Google New York office.
The catastrophic flood of 1987 casts a shadow over the Texas Hill Country calamity.
Bharat Bandh Live: Over 25 crore workers demonstrate as roads and railroads are closed
How Alia Bhatt's former assistant used fictitious bills to defraud the actor out of ₹77 lakhs
What took place in Los Angeles today during the shooting at the Westfield Century City Mall?
Kay Kay Menon announces a new date for the postponed release of Special Ops Season 2.
Fluminense v Chelsea: Club World Cup semi-final – live
The IPL is now worth more than Rs 158,000 crore. The Most Priceless Franchise Is...
Review of the OnePlus Nord 5 | The most comprehensive Nord to date
Live score for the third ODI between Bangladesh and Sri Lanka: Kusal Mendis achieves a century
Ahaan Panday and Aneet Padda promise an imperfectly perfect love story in the Saiyaara trailer.
Titan stock drops 5% despite analysts' continued optimism following the Q1 release.
Bharat Bandh on July 9: what will be open and what’s affected?
Test between India and England: Shubman Gill's team regains its swagger
WNS will be purchased by Capgemini for a total cash consideration of $3.3 billion.
The UAE Golden Visa is now available to Indians without a trade license or real estate purchase.
Gurmeet Choudhary Lauds Bihar’s Youth Icon Chirag Paswan, Says “I’m Your Fan, Brother
Amid delays about the Supreme Court collegium recommendation, attorneys withdraw their consent.
India and Malaysia discuss their bilateral trade and investment cooperation during the Brics Summit.
Mumbai Due to a technical issue, trains are delayed, causing a severe rush in the metro | Video
PM Modi praises Cuba and Malaysia for denouncing the horrific act in Pahalgam: MEA
At the BRICS Summit, PM Narendra Modi said that the Global South was being treated unfairly.
Himachal reels under monsoon fury: 23 flash floods, 19 cloud bursts, 16 landslides
World War could break out at any time, Nitin Gadkari said during an event in Nagpur.
Senior US official Bethany Morrison meets Dalai Lama in Dharamshala, says American Embassy
No double standards on terror": BRICS strongly condemn the Pahalgam attack
DHURANDHAR’S EXPLOSIVE FIRST LOOK DROPS! In Cinemas December 5, 2025
A team of UK experts travels to Kerala to fix a British F-35B fighter jet that has been grounded.
As conflict in Myanmar heats up, more than 2000 migrants arrive in Mizoram: Police
A 4.5-magnitude earthquake strikes the Andaman Sea.
A Tamil Nadu doctor was criticized for turning down a married man's proposal of marriage.
Just Like That: Birds chirp through stone and smog amid the bustle of Delhi
Puducherry cracks down on chemists flouting rules on sale of tuberculosis medicines
An anti-terror squad in Uttar Pradesh has arrested the mastermind of a religious conversion gang.
Bloodlines and battlelines: How Thackeray cousins came full circle | Timeline
Saif Ali Khan's ₹15,000-crore Pataudi property dispute in Bhopal has taken a hit.
Ahead of his 90th birthday, the Dalai Lama said, "It is important to work for..."
Aakash charges EY with professional malpractice for giving competitors conflicting advice.
When Thackeray cousins reunite, MK Stalin responds, "Upsurge against Hindi tremendously."
In London, Saif Ali Khan leads the way to lunch while Kareena Kapoor clutches Jeh's hand. Watch
Top 10 viral videos in social media how's your reaction
POTUS' July 4 video sparks responses as Trump seems to concede the 2020 race for the first time.
Greg Abbott, where are you? FEMA speculates after the flood at the Camp Mystic-Guadalupe River.
PM Modi's strong message against terrorism at Trinidad and Tobago: "Enemy of mankind"
Negotiators have returned from Washington, and the US trade deal is still being worked on.
Students were sent to law college by Monojit Mishra, who was arrested for rape.
Pahalgam attack casts shadow on Amarnath footfall, pilgrim registrations drop by 10%
Delhi lab's AI171 flight's black box data study: US and Indian techies on the analysis team
Top 10 temples in India who complete your desires
Metro…In Dino’ impresses with its music and realistic portrayal of modern-day romance
AAI Network Revival Efforts Are Led by Kolkata Airport's Record Profit
Following analyst downgrades and a warning of weaker growth in AGM, Trent shares plunge 9%.
A look at the procedure by which Deepika Padukone was granted a star on the Hollywood Walk of Fame
Israeli military positions are the target of a direct hit by a Palestinian militant group: Report
Putin told Trump during an hour-long call that Russia will not abandon its goals in Ukraine.
Liverpool footballer Diogo Jota died in a vehicle crash: How the mishap occurred
Corn and soybeans rise on sales, positioning themselves for the holiday weekend.
Through a block agreement, Bangas will sell a 2.1% Nykaa ownership valued at $140.3 million.
During a court session, a Gujarati lawyer is shown in a shocking video drinking beer casually.
A truck overturns on the Rishikesh-Chamba route, killing three Kanwariyas.
Copyright violation: SC rejects filmmaker's request to dismiss Kahaani 2 script case
"Bhai kya kar diya isne": A Chinese roadside barber cuts the hair of an Indian tourist
China responds to the Dalai Lama's comments by stating that Beijing must approve the successor.
Donald Trump is apparently considering deporting US citizens. "Get them the hell out."
"The world must show zero tolerance for terrorism," said Jaishankar in the United States.
According to Amit Shah, new criminal laws are approachable, affordable, and accessible.
Mehul Choksi, a Belgian prisoner, contests his fugitive status in the PNB fraud case.
Locals are encouraged to help a Dutch tourist who cleans Dal Lake in Jammu & Kashmir.
Sara Ali Khan and Aditya Roy Kapur take photos with admirers while riding the Mumbai metro.
Hollywood’s new favourite villain
Fire is contained aboard a ship with 14 Indian crew members by the Indian Navy.
The Digital India program changed lives and brought about a new age of self-determination: Modi
Massive blast at firecracker factory in Sivakasi, 4 dead
Odisha assault: Following assurances, the officers' association delays mass leave
UP Chief Minister Yogi Adityanath wishes Samajwadi Party leader Akhilesh Yadav a happy birthday.
The last minutes of Shefali Jariwala: an unsupervised IV drip, a fast, and a puja
The government and assembly speaker are in charge of selecting the LoP: Sena (UBT) MLA.
Gangaswells in Rishikesh, Uttarakhand; police and SDRF issue safety warnings
The new leader of the Telangana BJP is N Ramchander Rao.
Workers were flung 100 meters away: Witnesses describe the terrifying Telangana factory explosion
The testimony of a Kolkata rape survivor is supported by multiple pieces of evidence: Cops
The new chief of police in Kerala is Ravada Chandrasekhar.
Manipur: 4, including top Kuki commander, killed in suspected factional rivalry
A Delhi court permits the CBI to close the case of Najeeb Ahmed, a missing JNU student.
Paresh Rawal confirms his return to Hera Pheri 3: ‘We had to fine-tune ourselves…’
Chennai man smuggles 16 live snakes on Bangkok-Mumbai flight, arrested
At least 5 killed, over dozen injured in explosion at Telangana industrial unit
Vishnu Manchu uses a "leading director" to hint at a Kannappa prequel.
What Ukraine says about Russia's big aerial strike: "477 drones, 60 missiles"
What caused the stampede during the Jagannath Rath Yatra? Unexpected traffic and big crowds.
Russia's "largest aerial attack" downed an F-16 and killed a Ukrainian pilot.
Flash floods cause mayhem in Himachal Pradesh, killing 17 people and costing Rs. 300 crore.
Uttarakhand: A 24-hour suspension of the Char Dham Yatra due to a severe rain warning
An Air India flight headed for Chennai returns to Mumbai due to a "burning smell" in the cabin.
Jones and Hetmyer send Knight Riders to the bottom and give Orcas their second victory.
Mexico advances to the CONCACAF Gold Cup semifinals after defeating Saudi Arabia 2-0.
Austin FC vs. Seattle Sounders
The government intends to verify cellphone numbers for banks and apps.
West Bengal: College security guard arrested in Kolkata law college gang-rape case
At the centennial celebration of the Jain leader, PM Modi reiterates his opposition to terrorism.
Srilanka crush bangladesh in second test series
Review of the teaser for "The Family Man 3": Fans hail Manoj Bajpayee's comeback as "a masterpiece."
With a spectacular last-ball six, Hetmyer defeats Pooran to give the Orcas their first victory.
Review of Maa: Kajol's well-meaning film leaves the first half free and the second half confused
Nicholas Hoult Remembers David Corenswet and His Day at the "Superman" Audition
The final episode of Pankaj Tripathi's Criminal Justice Season 4 will air on...
Six Americans were apprehended attempting to ship Bibles and rice to North Korea.
Squid game season 3 when will release
Australia wins in three days thanks to Hazlewood's five-point haul.
Who is the husband of Shefali Jariwala? Five essential facts about Parag Tyagi
Shefali Jariwala, popularly known as the 'Kaanta Laga' girl, has tragically passed away.
Shekhawat establishes the Akhanda Godavari project's basis
The closure report for the Suraj Revanna case from 2024 is submitted by CID.
Rain causes hill chaos, and 12 people are thought to have died in an accident in Uttarakhand.
Hindi not an adversary, but companion to all languages: Shah
India and the US want to sign a trade agreement before the July deadline.
A excess of ₹95k cr is probably in the GST compensation fund.
After the Bonn talks conclude, India flags money.
Telangana woman was arrested for operating a vehicle over railroad tracks.
The SC will consider K'taka's request for clarification on the arrest grounds.
At today's hearing, the HC rejects Jagan's request to dismiss the hit-and-run case.
Amitabh Bachchan's robocall campaign against cybercrimes is ended by the center.
Mamata is in charge of Oppn's ECI push.
Donald Trump hints at ‘very big' trade deal with India after China pact
Ronaldo signed a new contract with Al-Nassr, a Saudi team.
To commemorate the Islamic New Year, Kebbi announces Friday as a public holiday.
West Indies versus Australia live score 1st Test Day 2 updates from Barbados
We like that Kareena Kapoor Khan refers to her relationship with Sanjay Leela as "love and war."
Chandimal and Nissanka increase Sri Lanka's power.
Muharram 2025 Commences: Saudi Arabia's Moon Sighting Verifies the Islamic New Year
The share price of HDFC Bank reaches a record high. Is the IPO of HDB Financial the cause?
Despite being a pro, Microsoft is planning to lay off additional employees in the Xbox division.
Chhattisgarh: An confrontation in Narayanpur results in the deaths of two female Maoists
Beginning on July 1, bus and truck drivers vow to go on an indefinite strike.
Teen detained in relation to the murder of a 21-year-old man in Meerut, Uttar Pradesh
Since the trough is still south of Delhi, the monsoon is delayed.
Coolie's first single ad drives fans into a frenzy, predicting a Chikitufied storm.
Pat Cummins reveals long-term number three plans for Australia in Tests
Today, June 25, Kerala University's UG Second Allotment 2025 has released.
Following a trooper's injury on I-80, NSP and NDOT officials ask drivers to contribute to safety.
DRDO collaborates with a private sector company to develop a 5.56x45 mm CQB carbine.
Despite winning at Ostrava, Neeraj Chopra believes his performance was lacking.
State Secretary of the State Great Khural Meets Representatives of the Inter-Parliamentary Union
Do you possess a midcap stock that you can purchase right now for a 20% gain?
Bangladesh is led by Shadman following two strikes prior to lunch.
Ola Electric Mobility block deal: Rs 107 crore worth of shares are traded, and the stock drops 6%
In the NY mayoral primary, a left-wing Democrat surprises the former governor.
TV Content Is Not Regressive, According to Hitesh Bharadwaj: "We Are Improving" | Exclusive
Shubhanshu Shukla space missions-know some interesting facts
Subscriptions for HDB Financial's ₹12,500-crore IPO begin today. Do you want to place a bid?
What are 'digital undertakers' and why you might need one before a US visa application
When will Ajay Devgn and Riteish Deshmukh's crime movie Raid 2 be available on OTT?
If you enjoyed Pankaj Tripathi in Criminal Justice Season 4, you may watch his popular films on OTT.
Game's not over': Iran says still got enriched uranium, will continue nuclear plan
Which American cities, in spite of the ceasefire, remain under high alert? This is the whole list.
Israel, Iran and the US claim victory after 12-day grueling combat. Who truly won?
4 killed in Israel's Beersheba after Iran's second assault amid ceasefire claims
'I Was Ignorant About It': RCB Coach Andy Flower's Yoga Practice in Rishikesh | Watch
Thales, IMG, and Panasonic all sign IFE deals with Qatar Airways.
AAP Defeats BJP In Big Gujarat Bypoll, Congress Scores Kerala Seat
Check out seven of Ajay Devgn's most impactful performances before Raid 2 premieres on Netflix.
Following his bombing of Israel, Trump's 12-year-old tweet gets viral. What he had said
Protesters throng US cities at anti-war protests, saying, "Will not allow you take the US into."
US officials sound warning amid Iran crisis, warn citizens of probable terrorist attacks
How the US military achieved stealth prior to Iran's strikes with a false B-2 Bomber mission
Iran's decision to shut the Strait of Hormuz: Four implications for Tehran, India, and the globe
Locals request a warning board after cricketer Ashwin is spotted taking a dip in a prohibited place.
After 16 billion logins were made public, internet users were recommended to update their passwords.
Dangerous escalation," Russia and China declared in response to US assault on Iran's nuclear sites.
I had no idea that this was my path: Dhvani Bhanushali on pursuing a career in music
Radhika Apte on the influence of foreign recognition on Indian audience: Regular public doesn't care
Explosions in Tel Aviv, other Israeli towns as Iran launches missiles after US strikes
Top Updates: Israel Attacks Iran's Nuclear Site in Isfahan, Killing 400 Iranians
Guwahati-Chennai IndiGo flight pilot raises 'mayday' signal, lands plane safely after scare: Report
Movies and TV series starring Dave Annable: From early parts until The Waterfront on Netflix
International Yoga Day is led by PM Modi, who refers to it as "humanity's pause button."
Women can obtain a passport without their husbands' approval or signature: HC
The CBI extradites Upavan Pavan Jain, a fraud suspect from the UAE, for ₹3.66 crore.
Delhi operations targeting Chinese cyber fraud networks resulted in the arrest of five people.
India will remove people from war-torn Iran from Nepal and Sri Lanka.
Very hard to stop Israel's strikes on Iran: Trump doubtful of possible ceasefire
Day 1 box office receipts for Kuberaa: Dhanush's film opens behind Raayan and brings in ₹13 crore
On World Music Day 2025, musicians remember their very first performance, from Papon to Anuv Jain!
Delhi will stop providing fuel to excess vehicles registered wherever in India on July 1. CAQM
Air India reservations are down 20% and rates are down 15% following the Ahmedabad jet accident.
What a rail link implies for Kashmir: from a commercial center to a backwater after division
Rahul Gandhi moves into his new official home on his 55th birthday.
At Royal Ascot, where was Kate Middleton? Tea is spilled by an insider.
California is seeing a rise in the new COVID strain "Nimbus," which produces "razor blade throat."
The split opposition in Iran demands a revolt, but activists are still apprehensive.
Flawed, imperfect people make for perfect and complete love stories!’ : Mohit Suri
Ajay Devgn's action comedy Son of Sardaar 2 will be released in theaters.
Kartik Aaryan Channels Devdas: Immerses Himself Fully for Anurag Basu’s Intense Love Story”
PM Modi expresses sympathy for the Pune traffic disaster and declares ex gratia
All alternatives on table" is Iran's warning against US engagement in the conflict with Israel.
Tensions in the Middle East and dollar bids from importers keep the rupee weak.
Did You Know Aditya Roy Kapur Joined Pragya Kapoor for an Environmental Cause? Producer Reveals
BJP MP Abhijit Gangopadhyay remains 'critically unwell', under strict surveillance in ICU
"They thought I was too tiny to be pretty," Banita Sandhu claims of being body shamed.
Music Review: HAIM return with a fantastic and bitter breakup album
TTD suggests renaming Renigunta Airport in honor of Lord Venkateswara in Andhra Pradesh.
Noida Sector 36 has a fire as a result of an AC explosion.
Government Asserts No Gaps in Defence Preparedness Amid Parliamentary Scrutiny
Why Shubhanshu Shukla's Axiom-4 mission has been postponed five times | Explained
Three Madras High Court judges avoid a potential train derailment attempt.
Israel-Iran conflict LIVE: Israeli strikes killed nearly 600 in Iran, human rights group says
The center authorizes Starlink to conduct business in India: Minister
Andhra Pradesh: An encounter kills three Maoists, including a member of the central committee
A Bengaluru man killed his sweetheart after taking her to Goa for their wedding.
Two members of an interstate cyber fraud group are taken into custody by Punjab Police.
Several Dreamliner overseas flights were canceled today, severely impacting Air India's operations.
Following Israeli strikes, satellite photos reveal damage to Iranian nuclear facilities
An Indian-American lawmaker will prevent Trump from becoming involved in the Iran-Israel dispute.
Amid continuing tensions in the Middle East, the G7 says Iran can never possess a nuclear weapon.
As the US and China issue a dire "evacuate Tehran" warning, fear of an Israel-Iran war intensifies.
The United States is sending more defensive capabilities to the Middle East. Hegseth, Pete
Iran Israel war in real time: Trump urges Americans to leave Tehran
DNA screening for victims of the Air India crash may conclude today; relatives await findings.
Trump instructed Israel not to kill Iran's top leader, says report
Governor Shukla of Himachal launches an anti-drug awareness campaign
The victim of the India airline crash flew home to bury his father.
Himachal is predicted to experience a wet spell until June 22: Met
Uttarakhand to set up command centre for real-time monitoring of helicopters
The lover was arrested for murder six months after a woman from Karnataka vanished.
As Israel's strikes rattle Tehran, India relocates its residents and students there.
Ahmedabad plane crash: Somber atmosphere on campus as people deal with loss on BJMC anniversary
According to IndiGo, Mumbai's intense rains temporarily disrupt flights.
From Housefull 5 to Happiness: Abhishek Bachchan's incredible 2025 journey
Odisha: preparations are on for the Puri Jagannath Rath Yatra, which will begin on June 27.
Did the US military parade invite Asim Munir to attend? Amid criticism, the White House clarifies
At Kuno National Park, a solar water pump protects cheetah babies from intense heat.
We will investigate all crash scenarios," said Aviation Minister Ram Mohan Naidu.
IMD issues a yellow notice for Himachal and Jharkhand and a heavy rain warning for Mumbai.
A Naga delegation requests that ancestral remains from the Pitt Rivers Museum in the UK be returned.
Copter crash: high-level meeting chaired by CM Dhami
In Shivpuri, MP, a young girl dies after slipping into a wastewater tank; residents protest
Hyderabad: Two unnamed people were electrocuted while dozing off on a pavement.
In Thiruvananthapuram, a British fighter plane makes an emergency landing.
DNA tests establish identity of 19 Air India plane disaster victims
Major victories in operations against the Maoists: Jharkhand CM
As the SCO denounces Israeli assault on Iran, India makes its "own" stance plain.
Date of the Rajasthan BSTC Pre-DElEd Result 2025: Scorecards Today, How to Verify
Claims of Air India disaster victims: "Asked to pay ₹1.1 lakh before flight"; MHA clarifies
In the Air India tragedy, Vishwas Kumar is the only survivor; his brother perishes.
Draft framework proposes sweeping changes to transport systems for persons with disabilities
Israel Iran live updates: Maj Gen Amir Hatami designated Iran's next Army head
Rajasthan is burning at 49.4°C, but tomorrow's pre-monsoon rains should provide some respite.
In Ahmedabad, the British High Commissioner meets with PM Modi over the plane disaster.
Air India accident scene hit 1,000 deg C; lava-like temperature left little scope for escape
In the stampede case, the Karnataka High Court granted bail to Sosale and three others.
Nifty falls below 24,473 points: Why is Indian stock market down today?
Rahul's allegations of rigging are denied by Maha CEO using data.
Families of the deceased recall the crash: "Not in the mental state to talk anymore."
India warns both countries to prevent escalation in response to Israeli airstrikes on Iran.
SC declines to give Congress extra time. MLA to turn himself up for the murder of a BJP leader
When the Air India flight crashed in Ahmedabad, who were the passengers on board?
Live updates on the Ahmedabad plane crash: PM Modi meets to evaluate the tragedy involving Air India
Air India flight to London crashes moments after take-off in Ahmedabad
Jodie Comer on joining Danny Boyle's 28 Years Later: “I Was Such a Huge Admirer of the First Movie
As tensions with the US increase, Iran issues a mysterious "we are ready" threat.
Following footage of soiled, outdated coaches, the railway sends a second special train for the BSF.
Seven Desi mocktails that are perfect for summertime that do not require a fancy bar setup
Panchayat 4 trailer: Election season brings havoc to Phulera, program gets an early release date
According to a top American general, the US needs ties with both India and Pakistan.
Why does the government forbid lowering the AC temperature below 20°C? What is the new regulation?
Elon Musk expresses 'regret' about last week’s posts on Donald Trump after feud: ‘Went too far’
By the end of the year, Deepika and Prakash Padukone's badminton school will have 100 centers.
Humnava Mere' from MAA drops now, embark on a soulful journey of love and emotion
Why was the Indian astronaut Shubhanshu Shukla's Axiom-4 launch delayed?
IAF will use mid-air refuellers and AWACS to grow more fangs.
India's two-time World Cup champion skipper, MS Dhoni, was admitted into the ICC Hall of Fame.
Axiom-4 mission: India's Shubhanshu Shukla's spacecraft launch has been rescheduled until June 11.
A horrific murder, an affair, and a honeymoon: The Sonam Raghuvanshi case that has rocked India
₹5 in India, ₹2349 in Gaza: Parle-G Biscuit Becomes Symbol of War-Era Inflation and Internet Outrage
Paresh Rawal to return in Hera Pheri 3? Actor's positive tweet gives new twist to controversy
How a tour guide contributed to the investigation of a honeymoon murder case in Meghalaya
Meghalaya honeymoon case: Wife arrested after hiring hitmen to kill husband
Israel asks military to stop aid ship carrying Greta Thunberg, GoT star from reaching Gaza
Amit Shah apologizes for not knowing Tamil at the Madurai event: "One of India's greatest languages"
Regarding the terminated employee who erased data, KiranaPro CEO: "We had disagreements but..."
Manipur: Curfew in place in Bishnupur, internet suspended amid violent protests
Colombian presidential contender Miguel Uribe shot in head during Bogota rally
States in India issue advisories as the number of COVID-19 cases surpasses 5,000 | View information
After the incident at Chinnaswamy Stadium, has Virat Kohli become a convenient scapegoat?
ICE arrests TikToker Khabane "Khaby" Lame in Las Vegas? What we understand
Pakistan urges India in several letters to reinstate the Indus Waters Treaty.
Russia launched the "biggest strike" on Ukraine to date, using 40 missiles and 400 drones.
A US legislator calls on a team from Pakistan to eradicate "vile" Jaish-e-Mohammed
Dishonest,’ ‘Unstable’: Trump and Musk's Feud Sets Internet Ablaze
Virat Kohli is being reprimanded for the rush that occurred during the RCB celebration in Bengaluru.
A doctor discusses the effects of changing seasons on skin and how to address them.
Revathi Kamath, the mother of billionaire Nikhil Kamath, rides the Bengaluru Metro: "It is so much."
The government approves Elon Musk's Starlink to introduce satellite internet in India: Report
Elections will take place in Bangladesh in April 2026, according to interim leader Muhammad Yunus.
Mark Carney of Canada calls Modi to invite him to the G7; the PM confirms his attendance.
RBI cuts repo rate by 50 basis points to 5.5%
In J&K, PM Modi opens the tallest railway bridge in the world across the Chenab River.
Following the sale of a ₹625 Cr stake by the company's MD, semiconductor stock declines.
2025 French Open semifinals: How to watch the Coco Gauff vs. Lois Boisson match
Where Can I Watch the Tamil Nadu Premier League on TV and the Internet in 2025?
Chhattisgarh: Bijapur encounter results in death of top Maoist commander
Donald Trump calls Xi Jinping amid the US-China tariff dispute
Meghalaya murder: Indore tourist's wife's final voicemail to family adds to the unsettling mystery
During RCB's IPL victory event, DK Shivakumar breaks down on camera over the Bengaluru stampede.
What led to the tragedy of the Bengaluru stampede? Karnataka Chief Minister Siddaramaiah discloses
IMD predicts heavy storms in eastern Uttar Pradesh and thunderstorms in South Bengal.
During the jubilation of the RCB victory in Bengaluru, a stampede claimed six lives.
Garena Free Fire Max: Use these June 3 redemption codes to get diamonds and other incentives.
Virender Sehwag, a former PBKS opener, believes RCB will win the IPL 2025 final, but with a twist.
IPL 2025 Final: Shreyas Iyer roars as Punjab Kings deliver early blow on Royal Challengers Bengaluru
Right to privacy not absolute, state has to prevent social harm: Madras HC
Usha Vance remembers meeting Modi and said that kids categorize him as a "grandfather."
In Spain, Kanimozhi of DMK inquired about ‘national language of India’. Her response is praised.
Punjab Police arrests spy for sharing information with Pakistan's ISI during Operation Sindoor
On June 2, there will be traffic restrictions for Telangana Formation Day activities.
Vikram Sugumaran, a Tamil director, dies of cardiac arrest in Chennai.
Registration for JoSAA Counseling 2025 opens tomorrow at josaa.nic.in. Here's how to apply.
Statistics: PBKS mounts Target 200+ once more
The FBI is looking into a "targeted terror attack" in Boulder, Colorado, but Palestine is free.
As the US rejects the WTO notification, India considers response.
The Mujib picture is replaced by Hindu and Buddhist temples on the new Bangladeshi banknotes.
Bengal: Influencer Sharmishta Panoli's arrest sparks a political dispute
Massive dust storms disrupt operations at Delhi's IGI airport, causing four flights to be diverted.
Ukraine targets Russian airbases and military aircraft with a major drone attack: Report
Countries now anticipate trade with Pakistan rather than a "begging bowl": Sharif Shehbaz
In the conflict with Pakistan, how many Rafales did India lose? The Defense Chief's remarks
Shashi Tharoor on Congress criticism over anti-terror delegation: 'Can't concentrate on it'
Operation Sindoor: What CDS disclosed about the 300-kilometer-deep penetration into Pakistan
Elon Musk used drugs while working for Trump and had a child with a Japanese pop star: Report
Congress cites the Chief of Defense Staff to demand openness regarding Op Sindoor losses.
CDS discusses the "huge" problem of Operation Sindoor, saying, "We elected not to be reactive."
Covid in India: Kerala and Maharashtra top the chart with over 3,000 active cases
Outrage when Pakistan's Shahid Afridi is welcomed by the Kerala community in Dubai: "Shameful"
Final extension’: DGCA lets IndiGo operate 2 Turkish planes for 3 more months
Congress and the BJP argue about surgical strikes, with Shashi Tharoor caught in the middle.
The fight against terror has neither ended nor halted," is PM Modi's most recent threat to Pakistan.
Punjab blast: Muktsar fireworks factory explosion claims five lives and injures 29
Congress claims six surgical strikes under the UPA amid the Shashi Tharoor controversy; BJP responds
Shehbaz Sharif describes how Pakistan's planned offensive was foiled by BrahMos: Watch
A Gujarat family of four died after an Indian was sentenced in the US for human trafficking.
The fresh Gaza truce proposal from Trump's Middle East envoy is accepted by Israel: Report
India requests "inclusive, free, fair" elections in Bangladesh.
Lashkar commander and "mastermind" of the Pahalgam terror strike appears in Lahore, Pakistan: Report
Three new SC judges will probably be notified by the union government today.
West Bengal needs freedom from politics of violence, corruption': Modi in Alipurduar
Time for Indian Defence PSUs to Either Deliver or Get Out of the Way
Even land of Mahatma Gandhi…’: Shashi Tharoor's ‘other cheek’ warning to Pakistan
On June 3, Punjab will conduct a mock drill.
Miami defeated Montreal 4–2 thanks to two goals and an assist from Messi.
How to Watch Man Utd vs. ASEAN All-Stars Live Stream and on TV
Do you know that Deepika Padukone was initially selected for THIS Ranbir Kapoor cult favorite?
3 Indians missing in Iran, Tehran asked to 'trace, ensure safety': Embassy
Return to India: Quebec's Indian students face severe criticism for protesting the French exam
What transpired the night before Sheikh Hasina was overthrown: "Shoot me, bury me here"
‘Don’t go left or right’: SC tells SIT to confine probe against Mahmudabad to 2 FIRs
Damage to Pakistani air bases during Operation Sindoor is depicted in new satellite photos.
Tomorrow is a mock drill in four Pakistani border states, weeks after Operation Sindoor.
What caused the IFCI shares to rise 74% in just 13 trading sessions?
India surpasses Japan as the world's fourth-largest economy.
Virat Kohli makes history by becoming the world's first player to...
May 26, 2026 is when GTA 6 is expected to premiere in India. Price, map, trailer, and other details
Can Royal Challengers Bengaluru place in the top two after nine years? LSG vs. RCB, IPL 2025.
What is the Fund Kaveri Engine, and why are internet users discussing it?
IpL match today Lsg vs RCB , Lucknow weather updates
Ashwani Kumar takes stunning catch to dismiss Prabhsimran Singh after dropping him in previous over
England is ready for the World Cup after an impressive series sweep.
IPL2025: Suryakumar Yadav Shatters the 15-Year Mumbai Indians Record Set by Sachin Tendulkar
Ricky Ponting to Punjab Kings: Nothing has been accomplished as of yet.
Saiyami Kher Set to Make Her Debut in Malayalam Cinema with Roshan Mathew
The immigration minister of New Zealand claims that she never responds to emails from Indians.
Rain in Mumbai causes waterlogging; IMD issues a 60 kmph wind warning and an orange alert.
Top food offers for Memorial Day 2025 at Krispy Kreme, Dunkin', and other locations
Shashi Tharoor on India's strategy against terrorism through Operation Sindoor: "New normal"
Melbourne mall closed after stabbing at Northland Shopping Centre as footage shows chaos
Was Jyoti Malhotra spotted with Rahul Gandhi? This is the real story behind the widely shared image.
Delhi weather: a strong storm causes 200 flights to be delayed and 49 planes to be diverted.
Crew rescued as ship with hazardous cargo sinks off Kerala coast, sparks environmental concerns
When and where can I see the action movie Sikandar OTT starring Salman Khan and Rashmika Mandanna?
RCB versus SRH, IPL 2025: Eshan Malinga Shines in Death Overs in Lucknow
Everything you need to know about actor Mukul Dev's life, family, and film career
SRH wants to end the season on a positive note and break the KKR curse.
A man gets arrested by Gujarat ATS for giving Pakistan access to private BSF and Navy information.
IMD: Kerala experiences its earliest monsoon commencement since 2009.
Former actor and model Mukul Dev passes away at age 54.
Pakistan was on the mat after the IAF fired four air-launched missile strikes on May 10.
How YouTuber Jyoti Malhotra was singled out by Danish, a former Pakistani high commission employee
Pakistan will be included to the FATF's grey list by India, according to a report.
This monsoon, Goa intends to attract tourists with treks and festivities.
Does chemistry alone make a relationship happy? Research shows what matters most.
Khushi Kapoor on rewearing mom Sridevi's clothes: ‘It’s my way of keeping her close’
Regarding terrorism, S. Jaishankar attacks Pakistan, saying, "They operate from huge cities."
A new wave of protests in Bangladesh prompts Muhammad Yunus to threaten to step down: Reports
Foreign students at Harvard University may be forced to leave the US
India sends Turkey a strong message: "Ask Pakistan to stop supporting terrorism."
Why and what will happen if Konkan Railway merges with Indian Railways?
Live Report: Will the Gujarat Titans make significant progress toward finishing in the top two?
IBM quietly rehires to cover the gaps after firing 8,000 employees for AI efficiency.
With Bethell slated to play a part against India, pressure is mounted on Pope and Crawley.
Why does Ben, the brother of Sam Curran, play for Zimbabwe rather than England?
Zimbabwe returns to the spotlight after a 22-year absence
Netizens Love Aamir Khan’s ‘Good For Nothing’ Track From Sitaare Zameen Par!
Seifert is brought in by RCB to replace Bethell, who is leaving for national duty.
Today's Shillong Teer Results: May 22, 2025, First and Second Round Winning Numbers
AI Technology Will Be Used by Tirumala Tirupati Devasthanams for a Smoother Darshan
Following a quarter-four net profit gain of 253%, solar stock surges 12%.
After eight decades, a rare Indian grey wolf may have been sighted in Delhi.
Toyota's New SUV Will Arrive Tomorrow for Rs 25 Lakh!
Which IPO should I bid on, Belrise Industries or Borana Weaves? Which has a better GMP?
Should you apply for Belrise Industries' ₹2,150 crore initial public offering (IPO)?
10/10 for Kiara Advani's "First Bikini Shot" in the War 2 teaser.
Vaibhav Suryavanshi's 33-ball 57 versus CSK demonstrates his maturity above his years.
Details on Harry Potter Reboot, which is expected to cost Rs 35,000 crore, can be seen here.
Weeks after the power outage, Spain's main cell and internet networks still unavailable.
For her "anti-India" activities, Nitasha Kaul, an Indian professor, lost her OCI status.
The army's declaration regarding the air defense guns at Golden Temple is denied by Head Granthi.
‘Courts cannot meddle unless glaring case made out’: CJI Gavai's remark on Waqf Act
Trinamool will be represented by Abhishek Banerjee in the delegation for Operation Sindoor.
A couple of Indian descent flees aboard a business class flight following a $2 million scam.
Young people with type 2 diabetes: A doctor identifies five causes for this alarming trend
Already battling with 140 crore: Sri Lankan Supreme Court requests a halt to deportation
What does Trump's directive on medication costs in the US contain, and will it be effective?
Does consuming fiber aid in weight loss? A dietitian responds to five important queries
Twinkle Khanna claims that she and Akshay Kumar got into a dispute over the Operation Sindoor movie.
The Delhi High Court will consider appeals against the BCAS ruling from the Turkish company Celebi.
Pakistan's attack on the Golden Temple was thwarted by the Indian air defense barrier. This is how
YouTubers and entrepreneurs: four Indians are being investigated for alleged espionage in Pakistan
Pakistani military bombed Golden Temple after India's airstrike against terrorists: Indian Army
TMC blames the Center for Yusuf Pathan's departure from the "terror outreach" delegation.
Five fresh IPOs and two listings are planned for next week; view the complete list here.
Arrested Haryana YouTuber Jyoti Malhotra had revealed ties with Pak official in her video | Watch
Ashoka University professor Ali Khan Mahmudabad arrested for remarks on Operation Sindoor briefings
At least 16 people killed in massive fire near Hyderabad's Charminar
-step strategy to producing meals that are both comfortable and heart-healthy
BYJU'S founder acknowledges making ‘business mistakes’, blames Russia-Ukraine war for crisis
220 million respectable Muslims…’: Owaisi’s warning to Turkey on backing Pakistan
Who is Jyoti Malhotra? YouTuber detained for allegedly spying for Pakistan
In Paharganj, Delhi, a building that was still under construction collapsed, killing three people.
Delhi pollution: What are the limitations of GRAP-1 and why was it implemented throughout the NCR?
Why the US credit rating was reduced by Moody's. Details
How India deceived Pakistan during Operation Sindoor by using unmanned phantom aircraft
Surbhi Jyoti confesses she and husband Sumit Suri have separate rooms at home: ‘It's rare’
Congress says PM Modi intends to grab ‘political mileage’ out of Operation Sindoor
Bollywood's most expensive film, greater than Pushpa, Baahubali, had 7 stars; trolls murdered it
Virat Kohli’s hawk-eyed followers believe he was seen utilizing a ‘Jaap counting machine’
Pakistan bowed down to the power of Brahmos missile: Rajnath Singh on Operation Sindoor
PM Modi gave Operation Sindoor the name Rajnath Singh.
Jaishankar: No discussions beyond fear, Indus Waters Treaty on hold
Nine major Indian airports have canceled Turkish Celebi Aviation's license.
What the IAEA, a nuclear watchdog, said about claims of a "radiation leak" at a site in Pakistan
View: Indian missile strikes during Operation Sindoor revealed Pakistan's strategic depth.
President Murmu asked the Supreme Court 14 questions about bill clearance deadlines.
To honor the Indian military's reaction, an Ayodhya couple names their son "Sindoor."
MoU with Turkish university suspended by JNU on grounds of "national security"
The major accusation made by a Pakistani minister is that Nawaz Sharif planned the attack on India.
Video: India's indigenous "Bhargavastra" counter-swarm drone system is successfully tested
The Turkish broadcaster TRT World's X and China's Global Times are restricted in India.
India Pakistan news LIVE: President is briefed on Operation Sindoor by CDS and Tri-services chiefs
Five simple daily actions you can take to prevent breast cancer
Do you like flowers? Try these dessert and snack options that include floral elements.
Death toll in Punjab hooch tragedy rises to 21, Opposition calls for CM Bhagwant Mann to resign
In response to PM Modi's statement about Operation Sindoor, Pakistan said, "I hope India will."
"Our targets were": India's response to the rumor of Pakistan's nuclear leak
Virat Kohli, Anushka Sharma seek blessings in Vrindavan a day after his Test retirement.
PM Modi's harsh warning to Pakistan at Adampur Air Base: "Ab koi terror attack hua toh.
India Pakistan LIVE: PM Modi promises to treat both terror masterminds and sponsors equally.
Three militants were slain in a clash with security forces in Shopian, J&K.
"India is eternally grateful": PM Modi meets IAF personnel at Punjab's Adampur Air Base
Operation Sindoor's heroes: the Integrated Air Command and Control System
When Salman Khan spoke up on why he didn't get married: ‘I can’t afford…
India attacked Karachi's Malir Cantonment: Operation Sindoor revealed by the IAF
"From Ashes to Ashes," said DGMO's Virat Kohli during the briefing for Operation Sindoor.
India-Pakistan live news: PM Narendra Modi will speak at 8:00 p.m.
This was the outcome of the Pakistani Mirage jet vs the Indian air defense system.
IAF: Did India hit Pakistan's nuclear plant at Kirana Hills?
India-Pakistan live news: PM Narendra Modi will speak at 8:00 p.m.
India Live news from Pakistan: DGMO starts press briefing on Operation Sindoor
All of that followed the "understanding" of the truce between India and Pakistan.
Sutton's predictions: Chelsea vs. Newcastle
As Villa wins and Man City falters, the Champions League battle heats up.
Kranti Goud makes his debut and bats for India, while Kavisha Dilhari is still out for Sri Lanka.
Rahul Gandhi writes to PM Modi demanding Parliament Session on Operation Sindoor, ceasefire
Donald Trump on India-Pakistan ceasefire: 'Will work with both nations on Kashmir solution'
What China told Pakistan regarding the India-Pak truce during high-level call
India Pakistan ceasefire news live: Operation Sindoor hasn't ended yet, says military
Impact of Indian armed forces felt as far as Rawalpindi: Rajnath Singh
PM Shehbaz Sharif applauds the ceasefire agreement as the Pakistani army targets Indian cities.
After the ceasefire agreement with Pakistan, the Indian military said, "Ceasefire on, but..."
Shashi Tharoor on the truce with Pakistan: "India wanted to teach terrorists a lesson."
Pakistan breaches ceasefire: Barmer on alert; drone strikes Jammu and Srinagar
Meet Vadodara's ‘Wonder Woman’ Shyna Sunsara, twin sister of Colonel Sofiya Qureshi
Marco Rubio's answer to S Jaishankar, who calls on India and Pakistan to defuse the situation
Explosions heard after suspected drone activities around Jaisalmer-Pokhran region
Pakistan moving troops to forward areas, shows intent to escalate tensions
Red Alert' Issued in Three Rajasthan Cities: Residents Ordered Home Amid Security Crisis
India Pakistan live updates: Fresh blast heard over Srinagar
Tensions between India and Pakistan increase; several places go into blackout | Complete list
India-Pakistan live: Ambala, Haryana, experiences a blackout following reports of Pakistani drones
IMD issues a yellow signal for Delhi tonight due to light rain and strong gusts.
Pakistan targeted India last night with 300–400 drones: Center
Religious sites are shelled, a new low even for Pakistan, according to a foreign spy.
Will ATMs Be Closed For Two To Three Days? Government Verifies Spreading Rumor
Real-time Updates: India-Pakistan War Gets More Intense and Widest in Decades
South Africa Women vs. Sri Lanka Women, Sixth Match: Live Score and Analysis
When Does IPL 2025 Start Up Again?
Here's how to verify the RBSE REET Result 2025.
Updates on Operation Sindoor: India claims that Pakistan is the de-escalation partner.
The game between PBKS and MI was moved to Ahmedabad.
Impact of Operation Sindoor: As tensions between India and Pakistan rise, PCB reschedules PSL games
India's message to Pakistan is to remember that the Pahalgam attack is an initial escalation.
Rajkummar Rao on his path since Sona Mohapatra's 2006 song: Still the same boy from "Aaja Ve"
Operation Sindoor live updates: China denies role of its jet in Indo-Pak confrontation
India hits Pakistan's defenses and stops a missile attack on these 15 cities.
Pakistan says India attacked using HAROP drones. Ten facts about them
A Saudi minister visits Delhi unexpectedly amidst tensions between India and Pakistan.
Live updates on Operation Sindoor: In Delhi, PM Modi hosts a high-level meeting.
What Asaduddin Owaisi stated about Pakistan during the Operation Sindoor all-party meeting
Punjab: Missile debris discovered in Amritsar villages following nighttime explosions
Indian airstrike in Operation Sindoor killed at least 100 terrorists: Rajnath Singh
Following Operation Sindoor, parts of Delhi and Mumbai experience blackouts during simulated drills.
Operation Sindoor LIVE: 15 people dead as Pakistan escalates firing along the Line of Control
Operation Sindoor live updates: Pakistan says 26 killed, 46 injured at 6 locations
India Responds to the Pahalgam Attack by Targeting Terrorist Bases in Pakistan
What is included in the "historic" free trade agreement between the UK and India?
On the Indus Waters Treaty, PM Modi stated, "India’s water used to go outside, it will now..."
India calls OIC statement on Pakistan standoff 'absurd': Islamabad 'misguided' group
Air Force To Hold War Games Along International Border With Pakistan
Vijay Deverakonda Urges Tilak Varma To Create Dance Reel To 'Kingdom Hridayam Lopala'
Before MI vs. GT, Rohit Sharma gives Mohammed Siraj a special T20 World Cup ring | WATCH
Live Report: MI middle order GT spinners run through
PM Modi refers to the free trade agreement between India and the UK as a "historic milestone."
The fashion industry is rocked by Rihanna's 2025 baby bump debut. The Met Gala
On the red carpet at the Met Gala, foreign journalists ask Shah Rukh Khan, "I am Shah Rukh."
Judges' assets are made public by the Supreme Court: What do CJI Sanjiv Khanna and others own?
Day after mock drill order, union home secretary convenes crucial meeting
Leading Producer Dil Raju Powers the Future of Film with LORVEN AI Launch
Gautami Kapoor recalls being terrified when a man molested her on bus: 'I was in my school uniform'
PM Modi's offer to travel to India is accepted by Russian President Vladimir Putin.
Pak hackers claim to have hacked multiple Indian defence sites
"Leave Canada": Indo-Canadians furiously denounce the warning from a fan of Khalistan
Pakistan test-fires 2nd missile as tensions with India mount over Pahalgam attack
Donald Trump gives a two-word answer on upholding the US Constitution
In J&K's Ramban, an army vehicle plunges into a 700-foot-deep chasm, killing three soldiers.
Air India's flight to Israel diverted to Abu Dhabi after missile attack at Tel Aviv airport
India stops the Chenab water flow through the Baglihar dam amid tensions in Pahalgam: Report
Amid tensions in Pahalgam, Imran Khan and Bilawal Bhutto's X accounts have been blocked in India.
IMF's Indian executive director Dr KV Subramaniam sacked six months before his term ends
Russia's Lavrov pushes for India-Pak dialogue in discussions with Jaishankar
For "concealing" his marriage to a Pakistani woman, a CRPF jawan was fired.
SriLankan Airlines flight from Chennai security-checked in Colombo for ‘suspect wanted’ in India
JD Vance praises ‘tough negotiator’ PM Modi, shares update on India-US trade deal
India has suspended the Instagram profiles of Muhammad Rizwan and Babar Azam.
India thwarts Pakistani hackers' attempts to breach Army websites.
Pawan Kalyan shares some tips he has for his family's depressed children: "Farm and feel hungry."
Live updates on the Pahalgam attack: UK calls for de-escalation and a calm approach
The murder that puts Mangaluru on high alert: who was Suhas Shetty?
IPO Calendar: Five SME offers to monitor next week, Ather Energy listing
Mahindra & Tata surpass Hyundai in April dispatches as the SUV war heats up.
Watch: Table Toppers Mumbai Indians Celebrate Hardik Pandya's 'Captain’s Knock'
Amit Malviya's jab at Bilawal Bhutto for Pakistan's admission of terrorism: "Fear is.
The second time in three months, a Nepali student commits suicide in the KIIT dorm in Bhubaneswar.
As relations with India increase, Pakistani FM stations cease playing Indian music.
Day 1 box office receipts for Raid 2: At ₹18 crore, the Ajay Devgn film earns more than Drishyam 2.
Can fat drag down intelligence? Doctor discusses brain and body link
Rajnath Singh dials US counterpart Pete Hegseth amid tensions with Pakistan
Amid tensions with Pakistan, Rajnath Singh calls his US counterpart Pete Hegseth.
Lives in his own world": Following the release of the new Rooh Afza video, Delhi HC raps Ramdev
Following the Pahalgam attack, Amit Shah warned terrorists, "Chun chun ke badla lenge."
Elon Musk's replacement as CEO is being sought by the Tesla board: Report
Bollywood stars that will attend the 2025 Met Gala include Kiara Advani and Shah Rukh Khan.
Its own league: A volleyball match in Assam is challenging preconceived ideas about sports.
Days after the Pahalgam terror assault, India blocks Pakistani aircraft from using its airspace.
The center's major move is to include the caste census in the upcoming demographic survey.
Mumbai Police Commissioner Deven Bharti, an IPS officer from the 1994 batch, was appointed
CISCE ISC, ICSE Result 2025 Date and Time: Result to be released at 11 am
DC vs KKR LIVE Score, IPL 2025: KKR's Rs 23.75 Crore Buy Flops Terribly After Poor Shot, Rinku In
When GT defeats RR, Vaibhav Suryavanshi's father exclaims, "Poora Bihar aur desh," with pride.
India's military action is imminent, and our forces have been reinforced: Pakistan's major assertion
India's military action on the way after Pahalgam attack, claims Pakistan minister
Filmmakers "amicably resolve" their plagiarism dispute with poet Yahya Bootwala in "Kesari 2."
HIT 3: Sailesh Kolanu respectfully asks the audience for
Day 1 of Ather Energy's IPO: Check the GMP, date, and price. Do you want to apply?
TS SSC Results 2025 Live: How to obtain the BSE Telangana 10th results as soon as they are announced
CM Stalin reorganizes the Tamil Nadu cabinet, and Senthil Balaji and Ponmudy resign as ministers.
Why is Phil Salt not playing for RCB against Delhi Capitals?
Mumbai indians vs lucknow super giants match scorecard
Indian CEO’s 400-Page Schengen Visa Application Sparks Debate on Passport Power
Mayank Yadav to play against MI? LSG drops massive hint before IPL 2025 clash
Anant, the youngest son of Mukesh Ambani, was named Executive Director of Reliance Industries.
Live updates for IPL 2025: Rahmanullah Gurbaz and Sunil Narine's eye-flying start in chase 202
Prabhsimran Singh makes history by becoming the first Punjab Kings player to go uncapped.
Mona Singh and the Magic She Brings: 5 Times She Proved She's the X-Factor in Every Storyline
Massive fire erupts at Lahore’s Allama Iqbal Airport, flights cancelled
MS Dhoni finally loses cool after CSK loss, saying 'you can't ..
Bank holiday today: Check here to see if banks are open or closed on Saturday, April 26.
Assam chief minister warns of NSA action against pro-Pakistan supporters in the live Pahalgam attack
Anshul Kamboj's ostentatious celebration following the smashing of Travis Head's stumps
Discover why the outcomes of this weekend's games may lead to additional Blank and Double Gameweeks.
In Chennai, Harshal and Kamindu lead SRH to their first victory over CSK.
Will not permit any water to enter Pakistan: Jal Shakti Minister CR Paatil
In response to the terror assault in Pahalgam, Donald Trump says, "That was a horrible one."
A Saudi minister contacts Islamabad and Delhi, and Iran offers to mediate the Indo-Pak conflict.
More than a mentor to me, Kasturirangan was a "intellectual titan": Pradhan Dharmendra
UP Board Result 2025 OUT Live: UPMSP 10th, 12th results available on HT Portal
Thudarum’ pre-sales touch Rs 2.33 cr in Kerala: Mohanlal-Shobana film off to a promising start
India notifies Pakistan about Indus Waters Treaty suspension: 'Breached conditions
What effects would the shutdown of Pakistani airspace have on Indian travelers and airlines?
As tensions with India rise, Pakistan suspends the Simla Agreement and blocks airspace.
When facing an unaltered RCB, RR bowls; Farooqi in
For five years, Manoj Bajpayee rents office space in Mumbai for around ₹11 lakh per month.
The names of the Pahalgam attackers are revealed by J&K Police, who also offer a reward of ₹20 lakh.
Instagram releases a clone of CapCut.
Pension can increase from Rs 1000 to Rs 7,500 soon? Know the latest update
This week, Intel will reveal plans to reduce its workforce by more than 20%.
Heatwaves will soon spread to Delhi, Haryana, and Punjab after UP and MP, the IMD says.
These are the suspects in the terrorist assault in Pahalgam that claimed 26 lives.
A day after the Pahalgam incident, two terrorists were killed in an encounter in Uri, Baramulla.
Survivors describe the tragedy of the Pahalgam attack: "My spouse was shot."
PM Modi denounces the terror incident in Pahalgam, saying, "Evil agenda will never succeed."
Live updates on the Pahalgam attack: Multiple fatalities are suspected, at least 12 tourists injured
What is in the open casket of Pope Francis? Things that will be interred in Rome with him
JD Vance's son is won over by PM Narendra Modi's dinner: "I believe I can live in India, Dad."
Modi's Live Visit to Saudi Arabia: The PM is greeted in Jeddah with a 21-gun salute
J&K: 12 tourists injured in terror attack in Pahalgam's Baisaran, PM Modi speaks to Shah
TS Inter Results 2025 Out LIVE: Telangana 1st, 2nd year Inter results announced
An IAF officer who became violent? Road rage in Bengaluru changes as CCTV footage surfaces
White smoke to "infirmarii": Definitions of Key Terms Following Pope Francis's Demise
US VP India visit LIVE: Trade on the topic, Modi-Vance talks to start soon
Rahul Gandhi's EC comment angers Fadnavis, who says it "raises doubts about his character."
Devkaali’s Divine Mystery Captivates Audiences, Niraj Chauhan’s Ardhanarishwar Look Wins Hearts
Breaking: Saif Verifies His Exciting Priyadarshan Project
Vatican Says Pope Francis Dies at 88
BCCI contracts: Pant is upgraded, Kishan and Shreyas return
Purchase HDFC Bank; Prabhudas Lilladher's aim is Rs 2125
ICICI Bank's Stock Reached a 52-Week High on Profits
The Mumbai Indians' impressive start against CSK is set up by Ryan Rickelton's explosive 24.
After the penalty drama, Max Verstappen ends his F1 interview early.
Padikkal and Virat Kohli's fifties propel RCB to their seventh away victory.
Nitish Kumar switches sides for ‘kursi’, his alliance with BJP opportunistic: Mallikarjun Kharge
Saurabh Mukherjea Declares ‘Salaryman Era’ Over, Urges Indian Middle Class to Rethink Job Security
View: Why India needs disruptive transformation in governance
Ice-man Avesh keeps his nerves as LSG edge past RR in last-over classic
IPL 2025: Live Score of RR vs. LSG: Jofra Archer cheaply fires Mitchell Marsh
After Punjab Kings' fifth IPL 2025 victory, Nehal Wadhera's quiet celebration goes viral.
UBSE UK Board Results for Grades 10 and 12 in 2025
RCB handing wins to visitors': Bengaluru MP PC Mohan after team's loss vs Punjab at Chinnaswamy
Do you need to know about GST on UPI transactions that exceed ₹2,000?
CSK sign Dewald Brevis to replace injured Gurjapneet
Good Friday Encourages Us To Value Compassion And Kindness": PM Modi
At Detroit, Royals lean on Cole Ragans to end skid
Jagiellonia holds Real Betis, but they advance to the Conference League semifinals.
Rahul Chahar's brief stint in the IPL 2025 fails to produce any breakthrough as SRH loses to MI.
Nazriya Nazim discusses why she "shut down entirely" and avoided the spotlight.
Today's focus is on Waaree Renewable shares because to their impressive Q4 earnings.
The Mavericks will compete for last place in the West after defeating the Kings.
In Maharashtra schools, Hindi is now required as a third language starting in Class 1.
China's response to the 245% tariffs imposed by Donald Trump: "If the US keeps doing..."
Which three major features of the Waqf Act have been highlighted by the Supreme Court?
Samantha Ruth Prabhu talks about periods and cycle syncing in her latest episode of Take20
Shiv Bhakt Sanjay Dutt channels his devotion in The Bhootnii’s First Track, Mahakaal-Mahakaali
Fatehsinh Khan, a baby boy, is welcomed by Zaheer Khan and Sagarika Ghatge.
Following impressive Q4 2025 earnings, IREDA shares surge 7%. Is this a good time to buy?
Wasim Jaffer wants a star from the Delhi Capitals to play for India in the England Test Series.
Launch of the Redmi A5 with a 32MP camera and 5,200 mAh battery: Cost, deals, and more
Unruly "Minecraft Movie" fans cause annoyance—and hope.
MK Stalin names a council to suggest policies for the autonomy of Tamil Nadu.
Strong Performance from Reliance Power Indicates Favorable Trends in the Growth of the Power Sector
Why has Donald Trump blocked Harvard University from receiving $2.2 billion in grants? Explained
All about 125-year-old extradition treaty India is using to bring Mehul Choksi from Belgium
Pinstripe Alley today, April 14, 25
Ireland will play Thailand in the ninth game.
How Mehul Choksi was perfected by CBI
Following Chennai Super Kings Pacer's request, MS Dhoni reluctantly accepts DRS. What Comes Next?
LSG vs CSK Live Score: Thrilling Clash Unfolds in IPL 2025
MS Dhoni Watches As Rishabh Pant Hits A Sublime Helicopter Shot In IPL 2025, Video Goes Viral
The Hungarian woman who is accused of honey-trapping Choksi, Barbara Jabarika, is who?
The ICC Women’s Cricket World Cup Qualifier 2025
How India and Belgium Jointly Stopped Mehul Choksi from Fleeing to Switzerland
Is This Big Khan Turning Singer? Here’s What We Know!
LIVE: English Premier League match between West Ham United and Liverpool
Watch: The bowler is shocked as Virat Kohli makes an easy catch, and the batter appears relieved.
DC chooses to bowl against MI, leaving out Faf du Plessis.
Salt and Kohli lead RCB to their fourth consecutive away victory.
Akash Anand, Mayawati's nephew, begs the BSP chief to pardon him for his errors.
China wants Donald Trump's reciprocal tariffs to be "totally canceled."
did Kim Sae-ron and WOODZ have a relationship? Their dating rumors are addressed by his agency.
In NIA detention, Tahawwur Rana asks 3 items - Quran, pen and…
Within an hour, four earthquakes rocked India and other Asian nations.
IPL2025: Sunrisers want to turn things around against the high-flying PBKS
Waqf-related rioting in Murshidabad, West Bengal, claims two lives: Police
President should decide on bills reserved for her consideration by Guv within 3 months: SC
Jaaved Jaaferi begs followers to report after claiming that his Twitter account has been hacked.
One of the three Pakistani terrorists slain in J&K was Jaish commander Saifullah.
For the second day in a row, Delhi and the surrounding areas are hit by a powerful dust storm.
Salman Khan debunks false fitness claims and picks fresh fruit from a branch with ease. Watch
Meet Ananya Birla: Billionaire Heir, Pop Star, and Entrepreneur Driving Change Across India
He is very hot," Khloe Kardashian says of the celebrity she would break her celibacy for.
ireland vs west indies women match 5 th March highlights
Nearly 50 killed in Bihar, Uttar Pradesh as lightning strikes, hailstorms wreak havoc
China responds by raising taxes on US imports by 125%.
Ayushmann Khurrana joins hands with Mumbai Police to Raise Awareness on cyber crime!
The Madness Returns! Malshej Ghat Schedule of ‘DHAMAAL 4’ Wraps
Apoorva Mukhija, an influencer, apologizes for her remarks on "India's Got Latent."
I am not afraid to try out various roles: Fatima Shaikh Sana
Deepika Padukone responds to the query: Bengaluru or Mumbai? This is what she says.
Following cancer therapy, Tahira Kashyap provides an update: "Recovering at home"
Why did Donald Trump halt elsewhere while increasing US tariffs on China to 125%?
US markets jump, see record greatest one-day gains after Donald Trump's tariff halt
UP CM Yogi Adityanath reveals June 27 as the release date Vishnu Manchu's Kannappa in Lucknow*
TMC MP Sougata Roy claimed that Mahua Moitra was crying during their "spat" with Kalyan Banerjee.
Donald Trump's 26% tariffs on India go into force.
The 26% tariffs imposed by Donald Trump on India take effect.
Relief for the middle class is imminent as the RBI lowers the repo rate by 25 basis points to 6%.
Aggressive In an enthusiastic farewell, Khaleel Ahmed yells at Shreyas Iyer.
Who is the second-fastest Indian player to reach an IPL century, Priyansh Arya?
IPL 2025 | Lucknow Super Giants edge Kolkata Knight Riders by four runs in a thriller
A WhatsApp conversation between TMC MPs about a "versatile lady" is leaked by the BJP.
Stock Market LIVE: Indian indices rebound; US' Dow Jones opens 1,230 points up, Nasdaq rises 3%
Allu arjun and atlee planned sci-fi blockbuster with Hollywood VFX team
After 12,000 years, dire wolves are back and howling.
The business that saved dire wolves from extinction is called Colossal.
Indian markets recover one day following a significant decline brought on by the Trump tariff shock.
Pawan Kalyan's son injured in fire at Singapore school: Jana Sena Party
Trump threatens to impose 50% more tariffs on China starting on April 9.
Rahul Gandhi takes potshots at PM Modi after market crash: ‘Trump has blown lid off illusion’
Review of The White Lotus Season 3: The show is worst season to date ends with a terrible climax
Telangana BJP MLA T Raja Singh claims that the new Waqf law will put an end to "land jihad."
As building starts, Shah Rukh Khan and his family leave Mannat. Watch
Sensex and Nifty have a "Black Monday" as stocks plummet due to the shock of the Trump Tariff.
Jim Cramer is who? According to a Harvard professor, markets will have a "Black Monday."
Live market crash: Nifty plummets 900 points, Sensex falls 2,800 points
India-backed railway projects in Anuradhapura are launched by Modi and the president of Sri Lanka.
Schedule of rocket launches in April 2025: NASA, SpaceX, and others – important dates disclosed
Users can now include music in their status posts on WhatsApp: Detailed instructions
Do you enjoy sugary drinks? Research shows a startling connection between them and depression.
Max Verstappen wins Japanese Grand Prix 2025, his first victory of the season
Ayodhya Live's Ram Navami: Surya Tilak of Ram Lalla today marks the start of the lavish festivities
In Ontario, Canada, an Indian was fatally stabbed; racism is thought to have been the motivation.
The guy is a lunatic’: US unifies in 1,200 protests against Donald Trump’s leadership
After Waqf, it's Christians now': Rahul Gandhi, Kerala CM slam RSS article on Catholic church land
The Modi government spends a lot of money to strengthen its military.
Kerala's chief minister and film industry lament star Ravikumar's passing.
PM Modi advised Muhammad Yunus to refrain from using language that degrades the environment.
Donald Trump tariffs explained: Which countries, sectors are most affected and who’s exempted
Manoj Kumar, an elderly Bollywood actor, passes away in Mumbai at the age of 87.
Four Easy Steps to Explain What Waqf Is
Vir Das will write his first memoir, "The Outsider."
Trump's tariff decision will be met with a measured and calibrated response from India: Official
Waqf Amendment Bill Live: Parliamentary Conflict Between Amit Shah and Akhilesh Yadav
A new petition regarding the Places of Worship Act is denied by the SC.
New ED charge sheet in "land for jobs" case against Lalu and relatives
Removing "weak" judicial cases: Parl panel to the government
Baghel is named by the CBI as an accused in the Mahadev app case's FIR.
Who is in favor of the Waqf Bill, who is against it, and does the BJP have a majority in Parliament?
As Donald Trump's tariffs "go into force immediately," there are three major unknowns.
India will significantly reduce tariffs: Trump's audacious assertion prior to "Liberation Day"
Actor & Director Niraj Chauhan’s movie "The Secret of Devkaali’s Trailer out
Who is Bajinder Singh? 5 things about ‘Yeshu Yeshu’ Punjab preacher and 2018 rape case against him’
"Amazing" response from Sunita Williams when asked "how does India look from space?"
Bajinder Singh, 'Yeshu Yeshu' pastor from Punjab, gets life term in rape case
YouTuber Mridul Tiwari owns the Lamborghini that collided with two people in Noida.
7.1 magnitude earthquake hits Tonga, triggers tsunami warning
"Can yall please chill?" is the ChatGPT chief's plea as Studio Ghibli shuts down the internet.
Earthquake in Myanmar: "Force of 334 atom bombs," 14 aftershocks, destroyed cities, 1,600 fatalities
US F-1 visa holders in shock over sudden revocation notices, students panic
Vande Media Pvt Ltd Set to Bring Dr. K.B. Hedgewar’s Story to the Spotlight with “Doctorji”
Mumbai's security has been stepped up as a post on X warns of "riots and bomb blasts" during Eid.
In Sukma, Chhattisgarh, 16 Maoists were killed in a clash with government troops.
Myanmar declares an emergency in six regions after today's earthquake, which killed 23 people.
Kavya Maran's parents, education, net worth, stake in SRH, and other pertinent information
Impact of Trump's Auto Tariffs: Why India Will not Experience Too Much Brunt
In Pictures | Ghibli meets AI: Netizens go crazy as they recreate famous scenes, memes, and moments
The opposition criticizes the BJP's silence on the PM Modi joke, and Kunal Kamra is called again.
Donald Trump announces 25% tariff on imported autos. What does it mean? | 10 points
India rejects the report of the US Religious Freedom Panel and labels it a "entity of concern."
If Hindus are safe, then Muslims are also safe in Uttar Pradesh’: CM Yogi Adityanath
Following massive success of Girls will Be Girls, Ali Fazal to back more women-led stories in films
When a Bengaluru founder posts an ad for an unpaid position, irate professionals disparage him.
Han Jong-hee, co-CEO of Samsung Electronics, passes away at age 63 from cardiac arrest.
DK Shivakumar denies claims of "Constitution modification" and labels the BJP's assertions as false.
IPL 2025 LIVE Score: Ashwin joins Dhoni in celebrating, prolonging MI's early suffering at Chepauk
In Kathua, J&K, a confrontation between security personnel and terrorists occurs.
Kishan's maiden IPL ton powers SRH to 287
IPL 2025 | RCB elects to bow after winning the toss
The Weaknesses of ChatGPT: A Sign of the AI Revolution’s Beginning, Not Its End
Is India Prepared for the Future Water Crisis?
Mohsin Khan is expected to be replaced by Shardul Thakur in the LSG squad for the 2025 IPL.
Is Instagram's Time Coming to an End?
DeepSeek’s Biggest Weaknesses: Is This AI Really Safe?
जो बाइडेन और नीतीश कुमार का मानसिक हालात एक जैसे? बिहार चुनाव पर पड़ेगा असर!
Within three days, Israel murders 200 youngsters in Gaza
Ukraine hits Russia's nuke-bomber airfield, massive explosion caught on camera
Why is the US attempting to deport the Indian researcher, and who is Badar Khan Suri?
As Adani enters the market, cable wire stocks are in disarray and KEI Industries' shares fall 14%.
Spreading Hamas propaganda': Indian researcher seized by immigration authorities in US
Nagpur violence shocker: FIR claims accused molested woman police officer, made obscene gestures
Sunita Williams live updates: health issues start as NASA astronauts land on Earth
Residents of Bengaluru may now reserve GPS-tracked Cauvery water trucks over the phone
When, where, and how will Sunita Williams return to Earth from the International Space Station?
Israel kills more than 60 people in "extensive strikes" in Gaza, Lebanon, and Syria.
PM Modi honors Debendra Pradhan: Learn everything there is to know about the seasoned politician
The AFCAT 01/2025 results are available for download.
Who Is Srikanth Bolla? MIT Alumnus And New Shark Tank India Judge
Jaat: धूम मचाने को तैयार 'जाट' का ट्रेलर, सेट से वीडियो साझा कर सनी देओल ने दिया फिल्म पर अपडेट
Premier League: Arsenal 1-0 Chelsea: Reaction and ratings after the game
Premier League matchup between Arsenal and Chelsea: Verified lineups and viewing instructions
Rannvijay opens up about his first MTV Roadies experience: MTV Roadies Double Cross
Tumko Meri Kasam' love Hits Pune: Ishwak Singh and Adah Sharma Wow Fans*
Get glowing hydrated skin on summer,skincare routine.
Pi Day 2025: Adding All Levels of Utilities to the Ecosystem Following Open Network
The War For Dharma Has Begun – 'Hari Hara Veera Mallu' Arrives At Theater On May 9th, 2025
John Abraham Meets External Affairs Minister Dr. S. Jaishankar*
Gurugram: Before firefighters arrive, a massive fire destroys the Kingdom of Dreams.
Elon Musk's Starlink to India is welcomed by Ashwini Vaishnaw, who remarks that it "would be handy.
Pakistan train siege ends, 346 hostages freed; 33 militants, 21 passengers dead
India will see the arrival of Elon Musk's Starlink. This is how it will operate.
State Level Police Recruitment Board of Assam announced PET Result Police Constable 2025
Indian carriers will compete with Musk's Starlink in the fixed wireless access market
MI loses to RCB and faces GG in the Eliminator; the Capitals go to the final.
Donald Trump's massive automobile threat to Canada: "Starting April 2, business will be closed.
India rejoices when you succeed: PM Modi in Mauritius
Electricity will be cut off: Ontario, Canada, imposes a 25% power tariff on the US
क्या बॉलीवुड का भविष्य अंधकारमय है? ओटीटी और नेपोटिज़्म के बीच उलझी हिंदी फिल्म इंडस्ट्री
India Triumphs Over New Zealand to Win Champions Trophy 2025
Mark Carney will take Justin Trudeau's place as prime minister of Canada.
In Sidhi, Madhya Pradesh, an SUV-truck collision claimed seven lives and injured fourteen.
India wins champions trophy 2025 Win Record 3rd Title
Cut off from people; sit far away, Gandhi reportedly told the workers
Yimmy Yimmy turns one & it’s still owning playlists worldwide! Jacqueliene’s hit era is legendary
Shami saheb, don't give a damn': Javed Akhtar backs Mohammed Shami amid Roza controversy
Fearless, fierce & unstoppable: How Balaji has given us iconic women who redefined strength
The top 130 greetings, sayings, and pictures to send to loved ones for Women's Day in 2025
IND vs NZ फाइनल अगर कराची में होता तो किसे सपोर्ट करते पाकिस्तानी ?
Golden Queen! Deepika Padukone raises the temperature as she graces the summit in Abu Dhabi today
बालाकोट स्ट्राइक के बाद भारत की दूसरी सर्जिकल स्ट्राइक की तैयारी? क्या था गुप्त प्लान?
Namibia vs Netherlands Live Score
Live updates for the ADRE Result 2025: Check cut-off, result out, and then what?
Vishnu Manchu Confirms Prabhas Did Not Charge for His Role as Rudra in 'Kannappa
VP Dhankhar and PM Modi attend the lavish wedding of Kumar Vishwas' daughter Agrata.
Imtiaz Ali and Sajid Nadiadwala’s Highway, starring Alia Bhatt, re-releases this Women’s Day
Infosys has mandated that workers work from the office ten days a month.
UPW vs MI, Live Score: Georgia Voll lifts UP Warriorz to 150/9 WPL 2025
Barcelona's performance versus Benfica was revolutionary.
Large NBFCs are instructed by the RBI to halt new loan lines and renewals.
Left in Limbo': Candidates Demand AIBE 19 Result
Arvind Kejriwal's Punjab visit for vipassana stirs 'luxury' row
Tejasvi Surya Ties The Knot With Carnatic Singer Sivasri Skandaprasad; First Pics Out
This is what co-star Rohit Saraf gave Janhvi Kapoor as a birthday present.
Ali Fazal reveals signing Raj & DKs fantasy period drama series Rakht Brahmand
March 5, 2025, Politics News Today Live Updates
Champions Trophy 2025: Pakistan and its supporters do not show up for the Gaddafi Stadium semifinal
Anup Jalota honored the team at the success party of the music video “Hamara College Mein Jaana
RRB JE 2024 CBT 1 Results Out, Cut-offs Announced check yours
Priyanka Chopra's Mom Breaks Silence On Deepika Replacing Her In Ram-Leela
SA vs NZ Live Score, Champions Trophy 2025 semifinal
भारत-पाक सीमा पर घुसपैठ की कोशिश नाकाम
The Character I Play Reminds Me of My Parents Love Story,” says Ishwak Singh on Tumko Meri Kasam
Netherlands vs Canada Live Score: Match 55 of ICC CWC League 2, 2023-27
Why Coforge Shares Soared Nearly 10% Today: A Detailed Analysis
India Storm into Champions Trophy Final After Thrilling 4-Wicket Win Over Australia
Phone 3a vs Phone 3a Pro: Price, camera, design, display, performance.
Is Samantha getting set to announce her next big screen outing?
Tamnnah Bhatia and Vijay Verma ends their relationship and be friends forever
ICC Champions Trophy 2025, India and Australia faced off
5 wickets down ICC Champions Trophy 2025
The Diplomat : John Abraham Praises Real-Life Indian Diplomat J.P. Singh
India vs Australia Live Score, ICC Champions Trophy 2025: challenge for Aussies on new ground
IND vs NZ, Champions Trophy 2025: India Stumble Against New Zealand’s Fiery Pace Attack
Tiger Shroff Unveils 'Baaghi 4' Poster on 35th Birthday; Netizens React Hilariously
Shraddha Kapoor Attends Wedding with Rumoured Beau Rahul Mody, Videos Go Viral
Bihar Politics: Dilip Jaiswal Misspells ‘Bihar’ – RJD Mocks, BJP State President Hits Back
Kannappa Teaser: Prabhas' Look Becomes the Highlight, Vishnu Manchu's Powerful Dialogues Impress
Galaxy Buds3 Series Brings Enhanced Convenience to the Galaxy S25 Series
Tuhin Kanta Pandey Takes Over as SEBI Chairman: A New Era Begins for India’s Market Regulator
Investors Lose Rs 7.46 Lakh Crore as Markets Crash Amid Trump’s Tariff Threats
Anurag Kashyap Joins Adivi Sesh and Mrunal Thakur in Bilingual Action Drama ‘Dacoit - Ek Prem Katha
Pi Coin Plunges 20% Amid Crypto Market Sell-Off, Faces Key Challenges for Growth
Sohum Shah Shines in Twister – A Must-Watch for Cinema Lovers
Deepika Padukone: Breaking Barriers While Building a Global Brand
Shreya Ghoshal on 'Chikni Chameli': Rethinking Lyrics & Responsibility
Sandeep Reddy Vanga & Ranbir Kapoor Reunite for Animal Park Sequel
Kuberaa Set for Grand Release on June 20, 2025 – A Cinematic Spectacle Awaits
Meta Promises to Fix Instagram Error After Users Report Flood of Graphic and Violent Content
Democracy at Risk? Comparing Trump’s Autocratic Approach to Modi’s Governance in India
WHO on Alert as Mystery Illness Kills Dozens in DRC
Luka Doncic Secures Historic Triple-Double as Lakers Defeat Mavericks
Big Owl & Initium Join Forces to Revolutionize Unscripted Content in India
Abhishek Bachchan's Be Happy Set to Premiere on March 14 – A Heartwarming Father-Daughter Tale
Rashmika Mandanna’s Heartfelt Take on Success Amid Chhaava’s Blockbuster Run
Dinesh Vijan’s ‘Chhaava’ Set to Roar in Telugu Cinemas, Riding on Unstoppable Fan Demand!
Kedarnath Dham to Open on May 2: Sacred Portal to Welcome Devotees in Auspicious Ceremony
महाशिवरात्रि व्रत कथा: शिकारी चित्रभानु को मोक्ष की प्राप्ति की प्रेरणादायक कथा
Yo Yo Honey Singh's ‘MANIAC’ Takes Bollywood by Storm with a Bhojpuri Twist!
India, Pakistan Hold Flag Meet to De-Escalate Border Tensions; Agree to Maintain Ceasefire
Pi Network Open Mainnet Launches: Pi Coin Now Tradable on Major Exchanges
6 Dynamic Director-Actor Duos We Can't Get Enough Of
Malavika Mohanan Reveals Why She Said Yes to Prabhas’ The Raja Saab
Mere Husband Ki Biwi – Honest Movie Review
Breaking: Shweta Tripathi to Venture into Film Production This Year
Sunny Deol Joins ‘Border 2’ – The Ultimate Patriotic Sequel Begins Filming in Jhansi
Ayushmann Khurrana Ignites Patriotism at WPL 2025 Opening Night with 'Maa Tujhhe Salaam
15 Bollywood Celebrities and Their Heartwarming Bond with Their Fathers
Vivek Agnihotri Slams ‘Selective Outrage’ Over Comedy Vulgarity Amid Samay Raina Controversy
John Abraham’s The Diplomat Trailer Unveiled: A Gripping Political Thriller on India’s Unsung Heroes
Kapil Sharma Meets MP CM Mohan Yadav Amid Shooting for Kis Kisko Pyaar Karoon 2 in Bhopal
Top 10 Must-Visit Places in Bhutan – A Complete Travel Guide
Ranveer Allahbadia Controversy: From YouTube to Parliament – The Firestorm Grows
From Signature to Skin: Tejasswi Prakash Fan's Tattoo Tribute
Sharvari Sets Internet Ablaze with Intense Beach Workout for YRF’s Alpha!
Britain’s Railway & Yash Raj Films join hands to celebrate the unifying power of love
दिल्ली चुनाव: भाजपा की ऐतिहासिक जीत और आगे की चुनौतियाँ
Ahmed Khan Reveals the Story Behind Shahid Kapoor’s Iconic "Dhan Te Nan" Hook Step from Kaminey
Zahan Kapoor Wins IMDb Breakout Star Award, Shares Rishi Kapoor’s Golden Advice
Ranbir Kapoor Wraps Up Recording for Vijay Deverakonda’s VD12 Teaser” Reveals Source
Loveyapa Movie Review: Junaid Khan & Khushi Kapoor Shine in This Eye-Opening Rom-Com!
Deva is a Hero-Worthy Acton Thriller
Randeep Hooda Joins John Cena and Director Sam Hargrave for Action-Packed Film “Matchbox”
ANUJA: Adam J. Graves’ Short Film Nominated for 2025 Oscars
Sky Force Movie Review : Akshay Kumar's Patriotism and Action Save the Day
Rashmika Mandanna’s Srivalli Sarees Are Back in Fashion with Pushpa 2: The Rule
Danube Properties Welcomes Bollywood Superstar Kartik Aaryan as Brand Ambassador
Tiger Shroff: Varun Dhawan's Top Pick as Bollywood’s Best Dancer
Chhaava: The Most Spectacular Hindi Cinema Experience Unveils Its Trailer!
Times Music and the Nandy Sisters embark on a thrilling new creative collaboration
Neha Kakkar Under Fire AI Platform Revelation Sparks Controversy on National TV
KANGNA SHINES BRILLIANT IN HER ROLE
Die Hard Fan Of Ram Charan Wins The Internet
Female Stars Who Transformed Unconventional Roles into Blockbuster Hits
Kartik Aaryan Celebrates Children’s Day with ‘Bhool Bhulaiyaa 3’ special screening for NGO kids
Bhool Bhulaiyaa 3 Advance Booking Now Open, Kartik Aaryan Shares a Quirky Video
Akshay Kumar to feed Shri Ram's monkeys in Ayodhya
Diwali Looks to Steal from These Stylish Bollywood Actors
Star-studded Diwali bash: Abhishek Kapoor’s Team Celebrates Upcoming Untitled Film in Style
IFFI 2024: NFDC India Announces Selection for Co-Production Market at Film Bazaar
Top 5 Celebrities Championing Sustainable Fashion – From Alia Bhatt to Aisha Sharma
Bollywood in Focus: A Mix of Popular Trends and Hidden Gems
Katrina, Madhuri, Sridevi inspired Sharvari’s passion for dancing
Our Stree aka Shraddha Kapoor praises Janhvi Kapoor for her latest song ‘Daavudi’!
Katrina Kaif joins Xiaomi India as brand ambassador
Kareena Kapoor Khan Starrer ‘The Buckingham Murders’ Trailer Launch Event Date Out
‘Super excited to face the camera again!’: Sonam Kapoor
Nimrit Kaur Ahluwalia emerges as a true All-Rounder in the latest season of Khatron Ke Khiladi
Riteish & Genelia Deshmukh’s Romantic Classic ‘Tujhe Meri Kasam’ to Re-Release on 13th September
It’s a Wrap for Pooja Hegde on the Sets of Deva
Excitement Peaks as 'Dhadkano Main' Song is Now Available!
Khel Khel Mein” Gains Momentum at the Box Office
MARVEL STUDIOS' DEADPOOL & WOLVERINE IS THE BIGGEST HOLLYWOOD OPENING OF THE YEAR 2024!
Sunday Saga is Biggest Web Series In Bollywood
Sharvari's Surprise Entry: 'I'm Ready to Shake Things Up' Says Debutante
Unleashing Action: A 99-Minute Bloodbath Adventure
O Baware: Joyous Celebration at Novaara with 'Pravaah - The Flow' Cast
Final Trailer Has Landed On The (fake) Moon!
"BJP's Targeting and TMC's Response: Mamata Banerjee on the Defensive"
"Sunita Kejriwal Voices Concerns Over Husband's Health and Treatment in Jail"
Rahul Gandhi’s Absence Marks INDIA Bloc Rally in Madhya Pradesh and Jharkhand
Uddhav Thackeray’s Claims Spark Political Storm: A Closer Look
P Chidambaram Criticizes BJP, Calls for Restoration of Democracy
Tejashwi Yadav Hits Back at Nitish Kumar’s Remarks: “Blessings From Our Opponent”
“Opposition’s ‘Nyay Ulgulan’ Rally to Highlight Political Concerns Amid Lok Sabha Election 2024”
"Controversy Surrounds Allegations of Medical Neglect Towards Arvind Kejriwal in Tihar Jail"
HD Kumaraswamy Addresses JDS-BJP Alliance and Political Dynamics
Controversy Erupts Over Doordarshan News Logo Change to Saffron
Prime Minister Modi Mocks Rahul Gandhi, Questions Congress Leadership
Prime Minister Modi Mocks Rahul Gandhi, Questions Congress Leadership
Aam Aadmi Party Alleges Conspiracy to Deny Medical Care to Arvind Kejriwal
Congress Leader Tajinder Singh Bittu Resigns, Likely to Join BJP
TDP Candidate Dr. Gottipati Lakshmi Puts Medical Duty First, Saves Lives Amid Election Campaign
First Phase of Lok Sabha Elections 2024: A Vibrant Start Amidst Challenges
First Phase of Lok Sabha Elections 2024: A Vibrant Start Amidst Challenges
"Union Home Minister Amit Shah Questions Congress on Electoral Bonds: 'Is That Also Extortion?'"
High Turnout Marks Udhampur Lok Sabha Elections in Jammu and Kashmir
Chautala Clan’s Electoral Battle in Hisar: A Family Saga Unfolds
Opinion Polls in Indian Elections: A Mixed Track Record
Prime Minister Modi’s Campaign Blitz in Western Uttar Pradesh
Atishi Alleges Plot to Harm CM Kejriwal Amid ED’s Dietary Claims
Arunachal Pradesh and Sikkim Gear Up for Assembly and Lok Sabha Elections 2024
BJP Candidate’s Controversial Gesture Sparks Outrage Before Elections
Mamata Banerjee Slams Mithun Chakraborty’s BJP Allegiance
Congress Leader’s Viral Image Sparks Political Speculation
"Political Drama Unfolds: AAP Accuses BJP and ED of Plotting Against Arvind Kejriwal's Health"
Rahul Gandhi’s Critique: Economic Disparities, Political Divisions, and Wayanad’s Challenges
Tamil Nadu’s High-Stakes Lok Sabha Election Battle: DMK-Congress vs. AIADMK-BJP
Kerala CM Criticizes Congress for Fielding Controversial Candidate Lal Singh
Congress Announces Candidates for Lok Sabha Elections in Odisha Amidst Multi-Phase Polling Schedule
West Bengal’s Ram Navami Clashes: Political Accusations and Communal Tensions
Arvind Kejriwal’s Wife to Join Nyay Ulgulan Rally in Jharkhand; AAP Sounds Alarm on Constitution
Unveiling Key Electoral Issues in Uttarakhand Ahead of Lok Sabha Elections 2024
Owaisi Criticizes BJP for Omitting “Minorities” from Manifesto, Alleges Discrimination
Manipur CM N Biren Singh Urges Support for BJP to Safeguard State’s Unity
“Political Intrigue Unfolds: Azad’s Critique of Rahul Gandhi’s Campaign Strategy”
"State-wise List of Constituencies for Lok Sabha Elections Phase 1, April 19, 2024"
“Mamata Banerjee Condemns Modi Government as ‘Jumlebaaz’ During Ram Navami Address”
“Priyanka Gandhi Takes a Stand Ahead of Lok Sabha Elections”
“Lok Sabha Elections 2024: Phase 1 Overview and Key Candidates”
“PM Modi Asserts BJP’s Victory with ‘Guarantee’ for 2024 Lok Sabha Elections”
“Rahul Gandhi and Akhilesh Yadav Unveil INDIA Bloc’s Vision Ahead of Lok Sabha Elections”
“Ram Navami: A Political Battleground in West Bengal’s Electoral Saga”
“Rahul Gandhi’s Political Chess: A Strategic Move in Uttar Pradesh’s Political Arena”
AAP Student Wing Protests Against Kejriwal’s Arrest, Terms it “Tyranny”
EC Bans Randeep Surjewala’s Campaigning for Derogatory Remarks
Mamata Banerjee Condemns Insult and Demands Transparency
Arvind Kejriwal’s Strategic Review from Tihar Jail
YS Jagan Mohan Reddy’s I-PAC-Driven Campaign: Strategies and Impact
Delhi’s North East Constituency Prepares for a Showdown: Kanhaiya Kumar vs. Manoj Tiwari
Amit Shah to Campaign in Manipur Amid Pre-Election Tensions
Congress Adapts Strategy: Fields Fewer Candidates in Lok Sabha Elections 2024
BJP’s Bishnu Pada Ray Raises Eyebrows: Alleges Nehru “Gifted” Coco Islands to Myanmar
Rajnath Singh’s Criticism on Tejashwi Yadav’s Navratri Video Sparks Controversy
Controversy Erupts in Karnataka Over BJP MLA’s Comments on Women Minister
BJP’s Manifesto Focuses on Fishermen Welfare Amidst Katchatheevu Island Row
BJP and Congress Lock Horns on Foreign Policy and National Security in 2024 Election Manifestos
Election Manifesto Showdown: BJP’s ‘Sankalp Patra’ vs Congress’s ‘Nyay Patra’
BJP’s Election Manifesto 2024 Criticized by Opposition Parties
BJP’s ‘Sankalp Patra’ for Lok Sabha Elections 2024: A Deep Dive into Key Promises
BJP’s “Sankalp Patra” Unveiled: Key Highlights and Responses
Political Turmoil Erupts in Baharampur: Tensions Escalate Between Adhir Ranjan Chowdhury and TMC
Congress Announces Fiery Contest Against Kangana Ranaut, Manish Tewari’s Political Saga Unfolds
"PM Modi's 'Noob' Remark Sparks Political Banter and Memes"
BJP Set to Unveil Manifesto “Sankalp Patra” for Lok Sabha Elections 2024
Chidambaram Foresees INDIA Bloc Triumph in Southern States, Mamata Banerjee’s Role in 2024 Elections
Controversy Erupts Over Bharat Mata Ki Jai Chanting Permission
Alleged Extortion and Political Connections: BRS Leader K Kavitha’s CBI Custody
Turmoil and Strategic Alliances: Congress Faces Challenges in Rajasthan
West Bengal’s Political Landscape Ahead of Lok Sabha Elections 2024
PM Modi Defends Constitution, Slams Opposition Ahead of Lok Sabha Elections 2024
Omar Abdullah’s Bold Challenge to BJP in Jammu and Kashmir
"Tharoor Talks Tough: BJP's Rise, Challenges, and Broken Promises in Kerala's Thiruvananthapuram"
ECI Streamlines Voting Process for Kashmiri Migrants Ahead of Lok Sabha Elections 2024
PM Modi’s Fiery Rally Speech: Accusations, Allegations, and Promises
Political Firestorm Erupts as Bengaluru Blast Suspects Arrested in West Bengal
PM Modi Announces Jammu and Kashmir Assembly Polls and Statehood Restoration
Misa Bharti Clarifies ‘Jail’ Remark, BJP Fires Back
BJP Faces Internal Challenges and Defections Ahead of Lok Sabha Elections 2024
Hema Malini’s Farm Photos Draw Online Criticism Amidst Election Campaign
BSP Announces Fourth List of Candidates for UP in Lok Sabha Elections 2024
Electoral Officer Alleges Bias: Intrigue Unfolds in Tamil Nadu’s Nilgiris Constituency
"Political Crossings: High-Profile Congress Leaders Join BJP Ahead of 2024 Elections"
Former Union Minister Birendra Singh Makes Ideological Shift, Joins Congress
Smriti Irani Accuses Rahul Gandhi of Alleged Ties with Banned Organization
“PM Modi Likens Congress to ‘Kadwa Karela’ in Maharashtra Rally”
“Assam CM Criticizes Congress Manifesto, BJP Labels it ‘Bundle of Lies’”
“Union Minister Rajnath Singh Praises Rahul Gandhi as Indian Politics’ ‘Best Finisher’”
“Shiv Sena Leader Raises Concerns Over Katchatheevi Island RTI Discrepancies”
“Shiv Sena Leader Raises Concerns Over Katchatheevi Island RTI Discrepancies”
“PM Modi’s Katchatheevu Challenge: Unraveling the Tamil Nadu Island Controversy”
PM Modi Accuses DMK of Neglecting Tamil Nadu’s Interests in Katchatheevu Island Issue
Supriya Sule Denounces BJP’s Alleged Strategy to Finish Off Sharad Pawar Through Baramati Contest
Mamata Banerjee Launches Fiery Campaign Against CAA, BJP Tactics in West Bengal
“Congress Unveils Star Campaigners List for Uttar Pradesh Ahead of Lok Sabha Polls”
“TMC Lodges Complaint Against BJP Chief Sukanta Majumdar Over Alleged Coercion”
“Apna Dal (Kamerawadi) Exits INDIA Bloc, Joins Forces with AIMIM for Lok Sabha Polls”
“Mamata Banerjee Roars in Krishnanagar: A Rally for Mahua Moitra and the Battle Against CAA”
“Political Intrigue Unfolds: Former Telangana CM KCR’s Bus Stop and Party Dynamics”
"Global Divides and Diplomatic Dramas: China's Controversial Universal Periodic Review"
Priyanka Gandhi Takes on PM Modi, Reminds of Lord Ram’s Message at INDIA Bloc Rally
TMC Asserts Commitment to INDIA Alliance Amid Speculations of Rift
Malaika Arora and Arjun Kapoor's New Look Has Fans Buzzing
FC Barcelona's Resurgent Form Continues with Emphatic Victory over Las Palmas
Easter: A Celebration of Jesus's Victory Over Sin and Death
Italy’s Torre Garisenda: A Tale of Leaning Towers and Renewed Hope
Treasures of Time Unveiled: 14th-Century Castle Rediscovered Beneath French Hotel
BRO Triumphs: Zoji La Pass Reopens Early, Boosting Frontier Connectivity
Unearthing Timeless Wonders: Mexican Pyramids Illuminate Ceremonial Astronomical Marvels
"Revamped Ride: Mumbai Shared Taxi Fares to Nashik, Shirdi, and Pune Set for Surge!"
Allu Arjun’s Iconic Journey: Wax Statue Unveiled at Madame Tussauds Dubai
Akshay Kumar’s Unyielding Commitment: Completing ‘Bade Miyan Chote Miyan’ Amid a Broken Leg
Sonam Kapoor Joins Tate Modern’s South Asia Acquisition Committee
Prithviraj Sukumaran Grateful for Role in Pooja Entertainment’s ‘Bade Miyan Chote Miyan’
"Tragedy Strikes: Mystery Surrounds the Murder of Samajwadi Party Leader's Wife in Hapur"
INDIA Block Maharally LIVE: Opposition Leaders Condemn Arvind Kejriwal’s Arrest
Suspended TMC Leader Sheikh Shahjahan Interrogated by Enforcement Directorate in Land Grab Case
Easter Wishes from Leaders: Modi and Murmu Share Joyful Messages
Purple Cap Glory: IPL 2024’s Top Wicket-Takers
Mayank Yadav: The Pace Sensation of IPL 2024
“Sizzling Start: IPL 2024’s Orange Cap Battle Intensifies with Surprises and Stars”
"Rahul's Roar and Yadav's Debut Delight: Lucknow Super Giants Outshine Punjab Kings in IPL Thriller"
GT vs SRH IPL 2024 Preview: Clash of Titans at Narendra Modi Stadium
Ravichandran Ashwin Defends Hardik Pandya Amidst Hostile Fan Reception
Virat Kohli’s Brilliance in IPL Overshadowed by RCB’s Defeat and T20 World Cup Scrutiny
Steve Smith Offers Support to Hardik Pandya Amid IPL Struggles
LSG vs PBKS IPL 2024 Clash: Lucknow Super Giants Secure Thrilling Victory
PM Modi Reignites Katchatheevu Island Controversy, Slams Congress in Tamil Nadu
“Political Spin Cycle: BJP’s ‘Washing Machine’ Welcome Sparks Social Media Storm”
"Kejriwal's Locked iPhone: The ED's Apple Conundrum"
Priyanka Gandhi Vadra Criticizes BJP for Welcoming Gali Janardhan Reddy
Opposition Leaders Gather for ‘Save Democracy Rally’ in New Delhi
Assam CM Stirs Controversy with Polygamy Remark, Promises Uniform Civil Code
NCP’s Supriya Sule and Sunetra Pawar to Face Off in Baramati Lok Sabha Battle
Pawan Singh Faces Criticism and Challenges Ahead of Lok Sabha Elections
Finance Minister Nirmala Sitharaman Emphasizes Welfare Beyond Caste and Religion in India
O Panneerselvam Faces Name Doppelgangers in Ramanathapuram Lok Sabha Battle
BJP Announces Election Manifesto Committee for Lok Sabha Polls; NCP Files Complaint Over Campaigning
Congress Accuses BJP of “Tax Terrorism” Amidst Fresh Notices, BJP Allies Hit Back
Congress Alleges Tax Harassment Amid Political Turmoil
Taliban’s Harsh New Decree: Women in Afghanistan Face Grim Future
"President Biden's Diplomatic Resolve Amid Gaza Protests: Navigating the Path to Peace"
“Royal Family’s Subdued Easter Amid Health Challenges”
"Embracing Grace: Heartfelt Messages for Good Friday Observance"
UK Economy in Shallow Recession, Rishi Sunak Faces Electoral Challenge
Thailand Makes Historic Move Towards same sex Marriage Equality
India-China Relations: Restoring Normalcy and Troop Deployment
Japanese Yen Plummets to 30-Year Low Against Dollar, Prompts Emergency Meeting
Baltimore Bridge Collapse: Indian Crew Averts Catastrophe, Heroes Lauded
King Charles III to Resume Public Duties Amid Cancer Battle
India’s $3.7 Billion Plan: Securing the Border with Myanmar Amid Rising Tensions
"Jaishankar's Diplomatic Tightrope: Navigating International Waters from Israel to Malaysia"
Earthquake Strikes Afghanistan: Magnitude 4.6 Tremor Recorded
Terror Strikes Again: Deadly Suicide Bombing Targets Chinese Nationals in Pakistan
Chaos Unfolds: Discord Over Moscow Concert Hall Massacre Investigations
President Biden Pledges Federal Aid After Baltimore Bridge Collapse
“Unexpected Harmony: Kohli-Gambhir’s Surprising Moment of Mutual Respect”
“Babar Azam’s Bid for Captaincy: A Tale of Redemption and Revival”
“Captain’s Conundrum: Hardik Pandya Faces Fan Fury Amid MI’s IPL 2024 Struggles”
“IPL 2024: KKR Surges, CSK Dominates, and LSG Seeks Redemption in Points Table Drama”
"Purple Cap Race Heats Up: Top Contenders After RCB vs KKR Clash in IPL 2024"
Virat Kohli Shines with Record-breaking Performance in RCB vs KKR Clash
Kohli-Gambhir Hug Adds Warmth Amidst KKR’s Dominant Victory over RCB
Kohli and Gambhir’s Heartwarming Exchange Steals the Show
Kohli Reigns Supreme: New Orange Cap Holder and Record Breaker
Clash of Titans: Kohli vs. Gambhir Rekindles at IPL 2024 Showdown
Virat Kohli vs Gautam Gambhir: A Rivalry Reignited in IPL 2024
Hardik Pandya Faces Backlash and Controversy as Mumbai Indians Skipper in IPL 2024
Overseas Player Controversy Adds Spice to DC vs RR Clash in IPL 2024
KKR Clinches Thrilling Victory Against RCB in IPL 2024 Clash
Exciting Clash Ahead: Lucknow Super Giants vs Punjab Kings in IPL 2024
“Orange Cap Race Heats Up: Heinrich Klaasen Leads, Riyan Parag’s Entry, and Shifting Ranks”
“Purple Cap Race Heats Up: Mustafizur Rahman Leads, Challengers Close Behind”
“R Ashwin Reflects on IPL’s Monumental Growth and Impact on Cricket”
CSK Tops IPL 2024 Points Table, Mumbai Indians Struggle: A Look at Team Standings and Performances
MS Dhoni’s Legacy Shines: Steve Smith Praises CSK Skipper’s Mentorship and Leadership
"Rajasthan Royals Roar: Riyan Parag Shines in Thrilling Victory over Delhi Capitals"
RCB vs KKR IPL 2024: Battle of Titans at M Chinnaswamy Stadium
CSK’s Dual Leadership: Dhoni vs. Gaikwad Debate Continues
IPL 2024 Points Table: Chennai Super Kings Lead, Mumbai Indians Struggle
"CSK Roars to Victory: Dhoni's Catch Ignites 'Tiger Zinda Hai' Chants"
Delhi Minister Kailash Gahlot Summoned by Enforcement Directorate in Money-Laundering Case
Top Events of the Day Unfold Across India
FIR Registered Against Telangana BJP Leader T Raja Singh for Hate Speech
President Droupadi Murmu to Confer Bharat Ratna to Five Eminent Personalities
Kangana Ranaut: From Silver Screen to Political Scene
TMC Shares Video of BJP Leader Challenging Own Party’s Candidate in West Bengal
Sadhvi Pragya Thakur Among Poorest Lok Sabha MPs: A Glimpse Into Her Profile
Kangana Ranaut’s Candid Remarks on Transitioning from Film Industry to Politics
Wealth Disparity Among Sitting Lok Sabha MPs: A Detailed Analysis
Bihar’s Electoral Chessboard: INDIA Bloc’s Seat-Sharing Pact and NDA’s Strategy Unveiled
Inside Muhammadabad: The Ansari Legacy and the Shadow of Controversy
Sunita Kejriwal Launches “Kejriwal ko Aashirwaad” Campaign Amid Delhi CM’s Arrest
Income Tax Department Issues ₹1,700 Crore Demand Notice to Indian National Congress
Nakul Nath’s Soaring Wealth: Insights from the Chhindwara Lok Sabha Candidate
The Life and Legacy of Mukhtar Ansari: From Gangster to Politician
Controversy Surrounds Mukhtar Ansari’s Alleged Poisoning in Jail and Subsequent Death
Congress Leaders to Unveil Manifesto Amid Election Strategy Talks in Jaipur
Congress President Kharge Rebukes PM Modi’s Critique of ‘Vintage Congress Culture’
Govinda’s Political Return: From Past Regrets to Present Inspiration
Bollywood Actor Govinda Makes Political Comeback, Joins Shiv Sena
PM Modi Slams ‘Vintage Congress Culture’ Amid Lawyer’s Concerns, Congress Hits Back
AAP Leader Accuses BJP of Operation Lotus in Punjab: Detailed Analysis
Delhi High Court Rejects PIL to Remove Arvind Kejriwal as Delhi Chief Minister
Chidambaram Critiques BJP’s Economic Policies, Highlights Distress in Indian Economy
India’s Richest Woman, Savitri Jindal, Resigns from Congress, Likely to Join BJP
Varun Gandhi’s Heartfelt Note to Pilibhit Constituents
M Abdul Salam: BJP’s Lone Muslim Candidate in Lok Sabha Elections 2024
Kangana Ranaut Clarifies Remarks on Urmila Matondkar Amidst Election Controversy
Lawyers Raise Alarm Over Threats to Judicial Independence in Letter to Chief Justice
Star-Studded Campaign: Shiv Sena Unveils 40 Star Campaigners for Lok Sabha Elections 2024
High-Stakes Drama Unfolds as Delhi CM Arvind Kejriwal’s Legal Battle Intensifies
Congress Opts Out Supriya Shrinate Amidst Controversy Over Kangana Ranaut Tweet
BJP Leader Anurag Thakur Compares Sunita Kejriwal to Rabri Devi Amidst Arvind Kejriwal’s Arrest
Viral Photo of Assam Politician Sleeping on Money Heap Sparks Corruption Controversy
Finance Minister Nirmala Sitharaman Declines Lok Sabha Candidacy Citing Financial Constraints
BJP Mocks INDIA Bloc’s ‘Infighting’ in Hilarious Video Ahead of Lok Sabha Elections
Delhi Assembly Session Proceeds Amidst Drama: Chief Minister Kejriwal Absent Due to ED Arrest
Communist Party of India (Marxist) at Crossroads: The Battle for Survival
Arvind Kejriwal's Legal Battle: High Stakes and Political Intrigue
Virat Kohli's Spectacular Form and World Cup Ambitions: A Tale of Excellence and Determination
Virat Kohli's Heroics and Shikhar Dhawan's Doppelganger: A Rollercoaster Clash in IPL 2024
Virat Kohli Registers Historic 100th T20 Fifty-Plus Score in IPL Thriller
TMC Unveils Star Campaigners and Candidates for Lok Sabha Elections 2024
BJP Alleges Bias and Partiality, Urges Election Commission for Fairness Ahead of Lok Sabha Polls
United States Closely Monitors Arvind Kejriwal's Arrest, Encourages Fair Legal Process
BJP MP Dilip Ghosh Sparks Controversy with Derogatory Remarks Against Mamata Banerjee
BJP Announces Candidates for Assembly Bypolls, Fielding Disqualified MLAs and Recent Joinees
Assam CM Predicts Bleak Future for Congress, Foresees BJP Dominance by 2026
Scindia's Political Legacy: A Journey Across Party Lines
AAP's Protest Against Arvind Kejriwal's Arrest Sparks Tensions in Delhi
Political Showdown Looms: BJP's Surendran Challenges Rahul Gandhi's Dominance in Wayanad
Congress Slams BJP Candidate Over Controversial Remarks on Gandhi and Godse
Deciphering the Art of Picking Ripe Pomegranates: Expert Tips for a Nutritious Summer Delight
Unveiling the Nutritional Odyssey: The Dramatic Narrative of Milk's Journey in Modern Diets
Banish Bloating with Nature's Bounty: A Nutritionist's Guide
"Decoding Dietary Dilemmas: Mediterranean vs. Atlantic Diets for Optimal Health"
"Divine Splendor: Exploring the Timeless Charm of Jagannath Temple in Ranchi"
"The Majesty of Heaven's Gate: A Journey into China's Natural and Cultural Marvel"
"Gateway to Adventure: Dramatic Destinations Welcoming Indian Travellers Visa-Free!"
St Helena: A Remote Island Unveils its Treasures to Adventurous Travelers
Backlash Against Tourism: Malaga Residents Urge Tourists to 'Go Home'
Enchanting Kashmir Embraces Snowfall and Rain, A Delight for Visitors
Hidden Treasures Unveiled: New Species Discovery in Kaziranga National Park
"Echoes of Extinction: The Tragic Saga of Kashmir's Vanishing Hangul"
Opposition Unites Against Arvind Kejriwal's Arrest: AAP Launches Intense Protest
UK's Nuclear Investment: Fortifying National Security and Economic Growth
A Diplomatic Dance: Maldives' Debt Dilemma and Neighbourly Dynamics
A Diplomatic Odyssey: Jaishankar's Reflections on India's Global Partnerships
Showdown Looms as New York Seeks $457 Million from Trump in Civil Fraud Case
China Restricts US-Made Microprocessors and Servers in Government Computers
Escalating Conflict: Russian Air Attack Sparks Emergency Power Outages in Ukraine's Odesa
Apple's Strategic Expansion in China: Tim Cook's Vision Unveiled
The Rise, Fall, and Potential Resurgence of Mixed Reality in 2024: A Comprehensive Overview
GTA 6 Trailer 2 Leak Sparks Excitement and Skepticism in Gaming Community
The Technological Revolution Unveiled: Elon Musk's Bold Vision for X Corp's Transformation
Sachin Tendulkar Reveals How MS Dhoni Became India's Captain
Rajasthan Royals Start IPL 2024 with a Bang, Defeat Lucknow Super Giants in Thrilling Encounter
High Drama Unfolds as RCB Clashes with PBKS in IPL 2024 Amidst Holi Celebrations
Hardik Pandya Faces Backlash as Mumbai Indians Captain: Social Media Criticism and Player Responses
AAP to Stage Protest Against BJP and Kejriwal's Arrest: 10 Updates
Congress to Announce Amethi and Raebareli Candidates After Holi, Speculations Abound
Assam CM Mocks INDI Alliance's Claims Ahead of Lok Sabha Elections
Naveen Jindal's Political Switch Sparks Controversy and Accusations of Corruption
Kangana Ranaut's Political U-Turn Sparks Controversy Ahead of Lok Sabha Elections
Shiv Sena MP Sanjay Raut Claims PM Modi Fears Arvind Kejriwal, INDIA Alliance Plans Protest Rally
AAP Leaders Continue Protest During Holi, Rally Planned Against Kejriwal's Arrest
Political Upheaval in Assam as MLA Bharat Chandra Narah Resigns from Congress Over Ticket Denial
Explosive Announcement: 'Bade Miyan Chote Miyan' Trailer Unleashing the Action Storm on March 26th
Kartik Aaryan Raises the Bar with Spectacular Song Shoot for 'Bhool Bhulaiyaa 3’
"Swatantrya Veer Savarkar" Storms Box Office with Record-Breaking Day One Collection
Akshay Kumar Steals the Show at TATA IPL 2024 Opening Ceremony with Electrifying Performance
Arvind Kejriwal's Arrest: Can a Chief Minister Run Office from Prison?
Arvind Kejriwal's Arrest Sparks Political Outcry and Support
The Evolution and Arrest of Arvind Kejriwal: From Activist to Chief Minister
Former Governor Satyapal Malik's Viral Video Prediction and Reaction to Arvind Kejriwal's Arrest
Sharmistha Mukherjee's Fiery Words: Arvind Kejriwal's Arrest and the Cycle of Karma
"Dedicated to the Country: Arvind Kejriwal Reacts After Arrest in Excise Policy Case"
"Drama Unfolds: Arrogance of Power and Betrayal - The Arrest of Arvind Kejriwal"
Unprecedented Legal Showdown: South Africa Accuses Israel of Genocide at the ICJ
CSK Starts IPL 2024 Campaign with Victory over RCB
Anna Hazare Criticizes Arvind Kejriwal's Arrest, Recalls Past Association
Arvind Kejriwal's Arrest Sparks Political Outcry and Allegations of Vendetta
Congress Internal Debate: Anand Sharma Questions Caste Census in Letter to Party President
Delhi Chief Minister Arvind Kejriwal Arrested by ED, AAP Vows to Run Government from Jail
BJP Files Complaint Against Rahul Gandhi's 'Shakti' Remark, Alleges Insult to Hinduism
Prime Minister Modi Faces Barrage of Abuses Ahead of 2024 Lok Sabha Elections
The Emotional Power of Fandom: How Meeting Allu Arjun Can Touch Your Heart
Chhattisgarh's Political Turmoil: Baghel's Bold Stand Amidst Scandal and Rhetoric
A Heart-Wrenching Tribute: PM Modi's Emotional Recall of Fallen BJP Leader 'Auditor' Ramesh
BJP Dares Rahul Gandhi Over "Shakti" Remark, Accuses Him of Insulting Hindu Culture
Uddhav Thackeray Accuses BJP of Attempting to "Steal" Another Thackeray Ahead of Lok Sabha Polls
Arvind Kejriwal Challenges ED Summons in Delhi Excise Policy Money Laundering Case
BJP MLA Aditi Singh Alleges Congress Leader Priyanka Gandhi of Character Assassination
Embrace the Sweetness of Jaggery: A Nutritious Summer Delight
Revving Up: Srinagar's Thrilling Debut with Formula 4 Car Racing
Breathless Nation: India's Air Pollution Crisis Revealed in New Report
Kunal Kemmu's Musical Debut 'Hum Yahin' Embodies Childhood Dreams and Unwavering Friendship
Epic Saga Unfolds: Ajay Devgn Unleashes 'Mirza' from Maidaan, a Cinematic Masterpiece in the Making
Clash of Tech Titans: Apple and Google in High-Stakes AI Negotiations
Royal Challengers Bangalore Triumph Over Delhi Capitals in WPL Final 2024
RCB Women Make History with Maiden Women's Premier League Title
The Goat Life: A Cinematic Odyssey Unveiled at the Mumbai Press Conference
"Shivaji Park Turmoil: Clash of Ideologies and Betrayals Amid Rahul Gandhi's Rally Fallout"
"The Enigmatic Rise and Fall of Santiago Martin: Unveiling the Shadowy World of the Lottery King"
Akhilesh Yadav Decides Not to Join Mumbai Mega Rally Due to Lok Sabha Elections 2024 Schedule
Top Ten Updates on Rahul Gandhi's 'Nyay Sankalp Padyatra' in Mumbai
Prime Minister Narendra Modi's Vision for India in 2047
Senior Citizens and Persons with Disabilities Can Opt for Postal Ballots in Lok Sabha Polls 2024
Bharat Rashtra Samithi Leader K Kavitha Remanded in ED Custody Amidst Protests
Rahul Gandhi's Epic Bharat Jodo Nyay Yatra Culminates in Mumbai Amidst Political Fervor
Omar Abdullah Criticizes Delay in Jammu and Kashmir Assembly Elections
Bollywood Icon Anuradha Paudwal Joins BJP, Congress and BJD Leaders Switch Sides
Corruption Unveiled: Congress Exposes BJP's 'Hafta Vasooli' Strategy Through Electoral Bonds Data
"Turbulence in Bihar Politics: Cracks Deepen as NDA Faces Seat-Sharing Storm"
Finance Minister Nirmala Sitharaman Defends Electoral Bonds Amid Criticism
Political Parties Clash Over Electoral Bond Data
India Pushes Back Against US State Department's Comments on Citizenship Amendment Act
ICC Mandates Stop-Clock Rule for T20 World Cup 2024 and Beyond
IPL 2024 Set for Star-Studded Comebacks: A Sneak Peek at the Returning Heroes
Patiala MP Preneet Kaur Joins BJP Ahead of Lok Sabha Elections
Former Bureaucrats Gyanesh Kumar and Sukhbir Singh Sandhu Chosen as Election Commissioners
India's Delicate Balancing Act: Tensions with Neighbors Pakistan and China Heighten
High-Level Committee Recommends 'One Nation, One Election': FAQs
New Election Commissioners Appointed Amid Controversy
Kerala Chief Minister Pinarayi Vijayan Denounces CAA Implementation as Unconstitutional
Supreme Court to Address Crucial Electoral Bonds and Election Commission Selection Cases
Mumbai Clinches 42nd Ranji Trophy Title with Historic Victory
IPL 2024: 10 Young Indian Players Set to Shine in the Tournament
Indian-American Siddharth Jawahar Faces Imprisonment in Multimillion-Dollar Ponzi Scheme
Japanese High Court Deems Denial of Same-Sex Marriage "Unconstitutional"
"Dahal's Triumph: Nepal's Political Saga of Power, Betrayal, and Resilience"
"Wallah Habibi" from Bade Miyan Chote Miyan: A Perfect Mood Setter
Groundbreaking Predictions on Artificial Intelligence Stir Global Debate
Apple's Vision Pro Mixed Reality Headset Revolutionizes Surgical Procedure
BJP Announces Second List of Candidates for Lok Sabha Elections 2024
Mamata Banerjee Severs Ties with Brother Over Political Disagreement
Kejriwal Sounds Alarm on CAA: Predicts Chaos, Riots, and Economic Fallout
Get Ready for Lok Sabha Elections 2024: How to Apply for Voter ID
Arvind Kejriwal Criticizes Government Over Citizenship Amendment Rules
CAA Implementation: Indian Government Reassures Muslim Citizens Amid Protests
Cricket's Fiery Saga: Anderson and Gill's On-Field Clash Revealed
Sunil Gavaskar Celebrates India's Triumph and Calls Out England's 'Superiority Complex
"Citizenship Amendment Act Implemented Ahead of Lok Sabha 2024 Elections: What You Need to Know"
"Haryana Political Turmoil: Speculation Rife as JJP MLAs Skip Meeting Amid BJP-JJP Rift"
Nayab Singh Saini Poised to Assume Chief Ministerial Role in Haryana Amid BJP-JJP Split"
"Congress Leader Padmakar Valvi Set to Jump Ship to BJP Amid Maharashtra Political Turmoil"
"Tensions Escalate: Medvedev Slams Macron as "Zoological Coward" Amid Ukraine Visit Delay"
"Vivo T3: Mid-Range 5G Marvel Set to Shake Up Indian Smartphone Market"
"Google Chrome Security Scare: Millions at Risk as New Vulnerability Emerges"
"Rishabh Pant Returns: IPL 2024 Ready After Heroic Recovery"
Virat Kohli's World Cup Fate Hangs in the Balance
"Enter the Magical World of Appu: First Official Poster Unveiled!"
"Unveiling the Spectacular: Bhool Bhulaiyaa 3 Promises Diwali Delight!"
"Unveiling the Forgotten Hero: Emraan Hashmi's Epic Transformation in 'Ae Watan Mere Watan'"
"Revitalize Your Diet: 5 Superfoods Every Woman Should Add for a Balanced Lifestyle!"
Congress Challenges ITAT Order in Delhi High Court
Congress President Questions PM Modi's Silence on BJP MP's Constitution Remarks
Supreme Court Rejects SBI's Plea, Orders Disclosure of Electoral Bonds Details
Meta Unveils Exciting Updates for WhatsApp Users
Apple Expected to Unveil iOS 18 with AI Enhancements and New Hearing Aid Mode
Kolkata Knight Riders Replace Jason Roy with Phil Salt for IPL 2024 Season
Tokyo Olympics Medalists Bajrang Punia and Ravi Dahiya Face Qualification Setback for Paris Olympics
Prime Minister Modi's Diplomatic Intervention Averts Potential Nuclear Crisis in Ukraine
US President Joe Biden Extends Ramzan Greetings Amidst Gaza Tragedy
Congress Central Election Committee Gears Up for Second Meeting
TMC's Shocking Candidate List Shakes Up West Bengal Politics
Kejriwal's Bold Campaign Call: 'No Dinner for Modi Voters,' as AAP Unveils Women Empowerment Scheme
Farmers' 'Rail Roko' Protest: Defiant Stand Against Injustice Echoes Across Punjab
Congress Leader Criticizes TMC's Candidate List and Alleges Political Calculations
TMC's Candidate List Announcement in West Bengal Dashes Congress' Seat-sharing Hopes
Ghulam Nabi Azad Denies BJP Allegations, Calls for Soul-Searching by Critics
Former BJP MP Brijendra Singh Joins Congress, Citing Political and Ideological Differences
Congress Forms Committee Amid Rebellion in Himachal Pradesh Unit
Bhartiya Janata Party Distances Itself from Controversial Remark on Indian Constitution
Chinese President Xi Jinping Extends Congratulations to Pakistan's New President Asif Ali Zardari
Russia's Election: A Foregone Conclusion or a Glitch in Putin's Matrix?
Apple Slashes Prices: iPhone 15 Now Cheaper Than Competitors in India
Brendon McCullum Reflects on England's Cricket Series in India
Ravichandran Ashwin Shines in 100th Test, Breaks Records
Telangana CM Praises AIMIM MP Asaduddin Owaisi, Announces Joint Efforts for Hyderabad's Development
PM Modi Unveils ₹55,600 Crore Projects in Northeast, Slams Congress for Slow Progress
Trump Secures $91.6 Million Bond to Delay Payment in Defamation Case
Vivek Ramaswamy Challenges TikTok Ban, Calls for Nuanced Understanding Amid Political Fray
India Launches Fastest Indigenous IP/MPLS Router, Marks Milestone in Digital India Vision
Banter on the Field: Shubman Gill and Sarfaraz Khan's Light-hearted Exchange with Jonny Bairstow
Akhilesh Yadav Mocks Yogi Adityanath's English Skills, Highlights Corruption Allegations
BJP Leader's Banter Goes Viral as Congress Defectors Join the Ranks
Omar Abdullah Criticizes RJD Chief's 'No-Family' Remark, Emphasizes Issue-Based Politics
Bharatiya Janata Party to Forge Alliance with TDP and Jana Sena for Lok Sabha Elections
Omar Abdullah Rejects Seat-Share Deal with PDP for Anantnag, Underlining Rift in J&K Politics
Omar Abdullah Criticizes BJP's Handling of Article 370 Abrogation
Congress Unveils First List of Candidates for 2024 Lok Sabha Polls in Kerala
Delhi BJP Mocks AAP's Lok Sabha Campaign Slogan
Congress Announces High-Profile Candidates for Lok Sabha Elections
Shashi Tharoor to Contest Lok Sabha Polls from Thiruvananthapuram, Kerala
Congress Announces Candidates for Lok Sabha Elections Across India
BJD and BJP Leaders Hint at Possible Pre-poll Alliance in Odisha Ahead of 2024 Elections
Arvind Kejriwal Accuses BJP of Coercing TMC MLA into Joining Party Amid ED Raid
Former Calcutta High Court Justice Abhijit Gangopadhyay Joins BJP, Eyes Political Career
Delhi Finance Minister Unveils ₹76,000 Crore Budget with Focus on Women's Welfare
BJP Leader Pramod Yadav Shot Dead in Uttar Pradesh; Assailants at Large
Biden Urges Hamas to Accept Gaza Ceasefire Deal Ahead of Ramadan
Donald Trump Seeks Funding Boost for 2024 Presidential Campaign, Meets Elon Musk
Michelle Obama Confirms She Will Not Run for US President in 2024
Nikki Haley Expected to Withdraw from Republican Presidential Race: Report
16 Assam Opposition Parties Warn Prime Minister Modi of Potential Volatility if CAA Implemented
Prime Minister Modi Inaugurates Kolkata Metro's Historic Underwater Tunnel
CBI Teams Await Handover of TMC Leader Shahjahan Sheikh Amid Controversy
PM Modi Blasts TMC, Stands with Women Ahead of International Women's Day
Arrest of BJP Worker in Pro-Pakistan Slogan Case Sparks Political Controversy in Karnataka
Arrest of BJP Worker in Pro-Pakistan Slogan Case Sparks Political Controversy in Karnataka
PM Narendra Modi's Rally in Barasat: A Focus on Women Empowerment and Bengali Culture
West Bengal CM Mamata Banerjee Boosts Anganwadi and ASHA Workers' Salaries
BJP Candidates List 2024: Notable Exclusions and the Party's Message
Priyanka Gandhi Vadra Set to Contest Raebareli Seat in 2024 Lok Sabha Elections
"Cross-Continental Alliance: Ukraine and Sudan's Unlikely Collaboration Against External Aggression"
ENPO Declares "Public Emergency" in Six Districts of Nagaland, Bans Political Campaigns
BJP Alleges Police Interference as Women Headed to PM Modi's Rally in West Bengal Face Obstacles
NDA Partners in Maharashtra Navigate Seat-Sharing Maze Ahead of Lok Sabha Polls
Himachal Pradesh Congress Takes Decisive Action Against Cross-Voting MLA Amidst Political Turmoil
Shocking Assault in Jharkhand: Another Incident Rocks the Nation
Samsung Galaxy S24 Series: Redefining Smartphone Experience with AI Innovations
Mumbai's Dominance Propels Them to Ranji Trophy Final
Mumbai's Chilly Spell Raises Health Concerns Amidst Weather Variations
Russia's Election Interference Tactics Extend Beyond Borders, Targeting Global Democracies
The Dark Side of Social Media: French Government Takes Action Against Unrealistic Beauty Standards
Kenyan Athlete Benson Kipruto Smashes Records to Claim Victory in Tokyo Marathon 2024
Shock and Outrage as Spanish Tourist Allegedly Gang Raped in Remote Area of Jharkhand
"Bastar: The Naxal Story" Trailer Set to Unveil, Promises a Riveting Tale of Courage and Truth
Rumors Swirl: Jr. NTR and Hombale Films Tease Epic Collaboration
Google Contemplates Removing Apps from Indian Companies Over Fee Dispute
"The Hunger Games of Test Cricket: Rohit Sharma's Fiery Battle Cry for Determination and Destiny"
Lautaro Martinez's Spectacular Milestone: A Tale of Grit, Glory, and Goals
"The Rumble of Titans: Ferrari's Triumph, Verstappen's Challenge, and Hamilton's Final Stand"
"Lewis Hamilton's Dramatic Farewell to Mercedes: A Journey Towards Ferrari Beckons"
"Brazil Assumes G20 Presidency: Crypto, AI, and Fintech in the Spotlight"
"Cristiano Ronaldo's Controversial Milestone: A 750th Goal Marred by Alleged Obscene Gesture"
"Ravichandran Ashwin: The Centurion Spinner's Magnificent Milestone Against England"
"Unveiling the Visionary: Ashok Veeraraghavan's Odyssey to Illuminate the Invisible"
"Tragedy Strikes: A Heartbreaking Tale of Love and Loss at Delhi Zoo"
"The Triumph of Hope: Unveiling the Revolutionary 'R+Cu' Tablet in the War Against Cancer"
"Embark on an Aerobic Odyssey: 8 Exercises for Weight Loss and Vitality"
Iron: The Silent Champion of Health and Vitality
"From Outsider to Icon: Bijay Anand's Epic Odyssey Through the Shadows of Nepotism"
"Dubai's Bold Leap: Unveiling the Five-Year Visa to Transform Indian Tourism Landscape"
"Dawn of Disruption: The Epic Saga of the US Cellular Outage Unfolds"
Unveiling the Potent Elixir of Health - Haldi Water's Heroic Role During Seasonal Transitions
The Coinage Conundrum: Ather CEO's Reaction Sparks Social Media Frenzy
Springtime Diet: Boosting Immunity with Seasonal Foods
India's Emerging Talents Shine Bright in Test Series Against England
Jio Studios and Mumbai Film Company unveil magnum opus – RAJA SHIVAJI
"Enchantment Unveiled: A Cinematic Odyssey with Laapataa Ladies"
"Echoes of Excellence: Zebronics' Symphony of Sound for Valentine's Day"
"The Enigmatic Glow of Saiee Manjrekar: An Ode to Radiance in Bollywood's Spotlight"
"2024 Unleashed: The Epic Quest for Unconventional Destinations"
"Conquest of the Crown: Ginger Tea's Epic Odyssey to Scalp Salvation"
"Pulsating Glory: Hardik Singh's Heroics in the FIH Hockey Pro League Showdown"
"The Rise of Raj Limbani: A Tale of Triumph and Transformation"
"Iran Unveiled: A Spectacular Voyage through Ancient Wonders and Vibrant Culture"
"Apple and Rivos Reach Settlement Over Trade Secrets Dispute"
"Musical Fusion: Bridging Cultures, Empowering Lives with Ridi Oswal"
"Beyond Borders: The Epic Odyssey of Visa-Free Exploration for Indian Adventurers"
"Umesh Yadav's Instagram Fury: A Tale of Snubbed Talent and Selection Controversy"
"Against All Odds: The Unlikely Quest of Sathish and Aadya for Olympic Glory"
"Saurashtra Cricket Association Honors Niranjan Shah with Stadium Renaming"
"Blunders Shape Outcome: Arsenal's Quality Seals Victory Against Liverpool"
"Revolutionizing Health: The 22-Minute Solution to Prolonged Sitting's Deadly Grip"
"Unlocking the Power of Hemp Seeds: A Nutritional Treasure Trove Revealed in a 100-Gram Serving!"
Deepika Padukone Applauds the team of Kho Gaye Hum Kahan says, "Congratulations Guys!"
Filmfare Awards: It's SRK vs SRK with him being nominated for Jawan and Dunki in Best Actor category
Samarth Jurel’s journey ends on COLORS’ ‘BIGG BOSS’ as votes fall short
Team #MerryChristmas Surprises Fans with ‘Twist Trailer’
Did Abhishek Kumar slap Samarth Jurel amid the race for captaincy on COLORS’ ‘BIGG BOSS’?
FILMMAKER SANDEEP SINGH'S SAFED SPARKS OFF CONTROVERSY - BANNED IN CERTAIN NATIONS*
Stardom pushes you to do better” - says global star Ram Charan
The biggest OTT debuts of 2023, from Shahid Kapoor to Bhuvan Bam to Dulquer Salmaan
World Saree Day: Sudhaa Chandran from COLORS' 'Doree' shares her love for six yards of Banarasi silk
Rakul Preet Singh Wraps Up Filming For Her Upcoming Venture! Graces Social Media with Heartfelt Post
Wild card entry Ayesha Khan exposes Munawar Faruqui in COLORS’ ‘BIGG BOSS’
From Bang Bang! to Fighter: What makes Siddharth Anand and Hrithik Roshan Click
Firoza Khan aka Khanzaadi bids farewell to COLORS’ ‘BIGG BOSS’
Namrata Sheth to lead web show Karmma Calling which also stars Raveena Tandon
Shruti Haasan to perform for the North East Festival with her band in Delhi
Dunki Drop 5, O Maahi OUT NOW! End the year with this musical treat!
From viral moments to unstoppable success - Saif Ali Khan’s signature appeal is unmatched
PM celebrates 50 years of diplomatic ties between India and Republic of Korea
PM to launch ‘Viksit Bharat @2047: Voice of Youth’ on 11th December
Prime Minister applauds singer Kailash Kher for his new song ‘Kashi Stuti’
Experts gather in Nanning to support high-quality development of Guangxi's night economy
COLORS’ ‘Shiv Shakti – Tap Tyag Tandav’ unveils the momentous birth of Kartikeya
Zarine Manchanda Journey of Business and Governance
Post Uttrakhand incident, schools take students to watch Pooja Entertainment's Mission Raniganj
Khushi Kapoor steps into Bollywood in mother Sridevi's iconic gown- A touching tribute
India judgment next-Stage T20 performance as of Shreyas, Chahar
*Ananya Panday to represent India at the Red Sea International Film Festival in Jeddah
Kaisi Yeh Dor' Trailer Launch: A Sneak Peek into the Heartwarming Tale Set in the Lanes of Banaras
IFFI 54 showcases Asian premiere of Moroccan Film “Fez Summer’ 55
Animal advance bookings open to a roaring response, with 10 thousand tickets being sold per hour
You don’t have to be a woman to tell a woman’s story; ‘Sanaa’ proves the same: Pooja Bhatt
OTT platforms should mentor the independent and creative cinema : Manoj Bajpayee
‘Odh’ bags the best film award at the ‘75 Creative Minds of Tomorrow’ at 54th IFFI
Celebrating Amit Dhawan's Breakthrough Role in Fukrey 3
BIGG BOSS’ warns contestants to tidy the house or kiss their belongings goodbye
Siddhant Chaturvedi Ignites Fan Frenzy at a Walkathon event in Mumbai
Malayalam film Aattam opens the Indian Panorama Feature Film Section at IFFI 54
Dunki: Drop 2 - Lutt Putt Gaya - The first track from Dunki is OUT NOW
Manipuri Film Andro Dreams opens the Indian Panorama Non-Feature Film Section at 54th IFFI
Alia Bhatt’s tremendous 2023 run; Secures #2 spot on IMDb's Most Popular Indian Stars
Triptii Dimri Finds Bliss in Bhopal's Charm on Day Off
Vir Das statement on winning the International Emmy for Best Comedy
New Film Incentive for Foreign Films
Hike in Incentives announced for foreign film production in India;
Malaika Arora calls Alizeh's debut in Farrey captivating and exceptional with a heartwarming note
Six Years On, Manushi Chhillar Continues to Shine After Her Miss World Triumph in 2017
Prepare to meet a different side of Ananya Panday
Subrata Roy chief of Sahara Group passes away
Diwali special - Akshay Kumar spends the day with Jawans on the field
Panorama Music acquires the music of film Joon
Gala Premieres Takes Centre Stage at the 54th IFFI 2023
Rani Mukherjee to do a Masterclass at IFFI 2023
Divyansh Pandit's Short Film 'Pind Daan' Premiere: A Night of Glamour and Gripping Narratives
This viral video will give you a glimpse into Akshay Kumar’s action packed life
Girnar Parikarma Festival India
Ranveer Singh Lights Up Jio World Plaza Launch with Electrifying Energy and Charisma in Mumbai
Not many know but I played Under-19 district level cricket!’ : Ayushmann Khurrana
Rajkumar Hirani brings a saga of love and friendship this Christmas with Dunki
Saira Banu's Heartfelt Birthday Wish for Shah Rukh Khan
Carry On Jattiye to release on 26 July
Zee Studios and Good Bad Films's Kennedy received a roaring response at the MAMI Film Festival
Panchmukhi Shivling Chandrashila Summit, Uttarakhand
Salman Khan and Ajay Devgn’s London Dreams clocks 14 years
Bateshwar Temple amazing place in India
12th Fail Strikes Gold at the Box office
Tune Into Audio Drama Day: The 5 Unmissable Series You Need to Hear
You haven’t even seen 1% of what we have in store in Tiger 3!’ : Maneesh Sharma
The Buckingham Murders' opened the Jio MAMI film festival
Always felt happy to entertain people with my films and songs!’ : Salman Khan
Karan Johar says Sidharth Malhotra fans will be very proud of the work he has done in Yodha
STAR STUDIOS AND CINE1 STUDIOS’ INTENSE SURVIVAL THRILLER ‘APURVA’ TRAILER OUT NOW
Ahead of Tejas release, Kangana Ranaut aka Tejas Gill seeks blessings at Ram Mandir in Ayodhya
Kamal Haasan thanks Vidhu Vinod Chopra for making a film like 12th Fail! See the video
I feel a strong sense of FOMO about not being a part of Big Boss 17…” reveals Sara Khan
Viacom18’s 'Shastry Virudh Shastry' staring Paresh Rawal to release on November 3rd 2023
Nora Fatehi undergoing rigorous training to learn Telugu for her debut in Matka
BIGG BOSS house as Abhishek Kumar and Sunny Arya clash
Aditya Dhar’s next inspired by true events with a gripping story and exciting visuals
Sunny Leone's "Mera Piya Ghar Aaya 2.0" Breaks Records with 15 Million; Fans and Critics Love It
Happy Birthday Prabhas: Fans throng in huge numbers outside Pan Indian superstar’s residence!
*Bhuvan Bam dedicated over 120 days to perfect scripting and dubbing for Takeshi Castle Reboot
Rasika Dugal Hints the Release of Mirzapur Season 3
Mark Your Calendars: 'KAISI YE DOR' Film Release Date Announced
Shilpa Shetty Radiates Elegance in Amit Aggarwal's Pink Saree
Actress Geeta Basra soaks in the festive fervour as she keeps Navratri Fast for the first time
Shalini Gaur Making Waves in Entertainment Industry
"निर्माता राहुल बॉम्बे ने पाइपलाइन में रोमांचक नई परियोजनाओं के साथ पोर्टफोलियो का विस्तार किया"
Taina Blue Retreat is a Converted Tower on the Greek Coast
Reating a vision for the future: how technology will revolutionise the business finance function
Entertainment partners chill at home with a few must-see movies or head out for
U.S. fuel markets are getting even tighter as Europe’s scramble
The seven-member group filmed a music video in the world body’s New York headquarters
A woman gave birth to a baby boy on a plane in Paris early tuesday morning.
New york to attend 76th United nations general assembly
Technical View: Nifty bulls may eye breach of 200-day EMA; Bank Nifty above all key moving averages now

- Richa Pandey
- 20 Mar, 2025
The Indian equity markets have been a focal point for investors and traders alike, with the Nifty 50 and Bank Nifty indices showing significant movements in recent weeks. As of [insert date], the technical outlook for these indices suggests a bullish sentiment, with the Nifty 50 eyeing a breach of the 200-day Exponential Moving Average (EMA) and the Bank Nifty trading above all key moving averages. This article delves into the technical aspects of these indices, analyzing key levels, trends, and potential scenarios for traders and investors.
Understanding the Key Indicators: Moving Averages
Moving averages are one of the most widely used technical indicators in stock market analysis. They help smooth out price data to identify trends over a specific period. The two most commonly used moving averages are the Simple Moving Average (SMA) and the Exponential Moving Average (EMA). The EMA gives more weight to recent prices, making it more responsive to new information compared to the SMA.
- **200-Day EMA**: This is a long-term moving average that is often used to gauge the overall trend of the market. A price above the 200-day EMA is generally considered bullish, while a price below it is seen as bearish.
- **50-Day EMA and 100-Day EMA**: These are medium-term moving averages that help identify intermediate trends.
Nifty 50: Bulls Eyeing Breach of 200-Day EMA
The Nifty 50 index, which represents the performance of the top 50 companies listed on the National Stock Exchange (NSE), has been showing signs of strength. As of the latest trading session, the index is hovering near its 200-day EMA, a critical level that could determine the next phase of the market trend.
Current Scenario
- **Price Action**: The Nifty 50 has been consolidating near the 200-day EMA, which is currently around the [insert level] mark. A sustained move above this level could signal a bullish breakout, potentially leading to further upside.
- **Volume Analysis**: Trading volumes have been relatively high during the recent upward moves, indicating strong buying interest. This is a positive sign for the bulls, as higher volumes during price increases suggest conviction among buyers.
- **Support and Resistance**: The immediate support for the Nifty 50 is around the [insert level], which coincides with the 50-day EMA. On the upside, the key resistance levels to watch are [insert levels]. A breach of these levels could open the door for a rally towards [insert target].
Technical Indicators
- **Relative Strength Index (RSI)**: The RSI is currently in the [insert range], indicating that the index is neither overbought nor oversold. This suggests that there is room for further upside if the bullish momentum continues.
- **Moving Average Convergence Divergence (MACD)**: The MACD line is above the signal line, and the histogram is in positive territory, indicating bullish momentum.
Potential Scenarios
1. **Bullish Breakout**: If the Nifty 50 manages to close decisively above the 200-day EMA with strong volumes, it could trigger a bullish breakout. This scenario would likely attract more buyers, pushing the index towards higher resistance levels.
2. **Bearish Rejection**: If the index fails to breach the 200-day EMA and starts to decline, it could indicate a bearish rejection. In this case, the Nifty 50 might retest its support levels, potentially leading to a deeper correction.
Bank Nifty: Trading Above All Key Moving Averages
The Bank Nifty index, which tracks the performance of the banking sector, has been outperforming the broader market. As of the latest trading session, the index is trading above all key moving averages, signaling strong bullish momentum.
Current Scenario
- **Price Action**: The Bank Nifty is currently trading above its 50-day, 100-day, and 200-day EMAs, which are positioned at [insert levels]. This is a strong bullish signal, indicating that the banking sector is in an uptrend.
- **Volume Analysis**: Similar to the Nifty 50, the Bank Nifty has seen higher trading volumes during upward moves, suggesting strong buying interest.
- **Support and Resistance**: The immediate support for the Bank Nifty is around the [insert level], which coincides with the 50-day EMA. On the upside, the key resistance levels to watch are [insert levels]. A breach of these levels could lead to a rally towards [insert target].
Technical Indicators
- **Relative Strength Index (RSI)**: The RSI for the Bank Nifty is in the [insert range], indicating that the index is neither overbought nor oversold. This suggests that there is room for further upside if the bullish momentum continues.
- **Moving Average Convergence Divergence (MACD)**: The MACD line is above the signal line, and the histogram is in positive territory, indicating bullish momentum.
Potential Scenarios
1. **Continued Uptrend**: If the Bank Nifty continues to trade above its key moving averages and breaks through the immediate resistance levels, it could continue its upward trajectory. This scenario would likely attract more buyers, pushing the index towards higher targets.
2. **Pullback**: If the index faces resistance and starts to decline, it could pull back towards its support levels. However, as long as it remains above the key moving averages, the overall trend would remain bullish.
Sectoral Analysis: Banking Sector Leading the Charge
The strong performance of the Bank Nifty is a reflection of the overall strength in the banking sector. Several factors are contributing to this bullish sentiment:
- **Improving Asset Quality**: Banks have been reporting improvements in asset quality, with a reduction in non-performing assets (NPAs). This has boosted investor confidence in the sector.
- **Credit Growth**: There has been a steady increase in credit growth, driven by demand from both retail and corporate segments. This is a positive sign for the banking sector, as it indicates healthy economic activity.
- **Interest Rate Environment**: The Reserve Bank of India (RBI) has maintained a relatively accommodative monetary policy stance, which has supported lending activities. However, any future rate hikes could impact the sector, so this is a key factor to watch.
Broader Market Outlook
While the Nifty 50 and Bank Nifty are showing bullish signs, it's important to consider the broader market context. Global factors such as geopolitical tensions, inflation, and central bank policies can have a significant impact on the Indian equity markets. Additionally, domestic factors such as corporate earnings, economic data, and government policies will play a crucial role in shaping market trends.
Key Levels to Watch
- **Nifty 50**: A decisive close above the 200-day EMA could signal a bullish breakout, while a failure to breach this level might lead to a pullback.
- **Bank Nifty**: The index is already in a strong uptrend, but traders should watch for any signs of weakness or resistance at higher levels.
Conclusion: A Bullish Bias with Caution
The technical outlook for the Nifty 50 and Bank Nifty suggests a bullish bias, with both indices showing signs of strength. The Nifty 50 is eyeing a breach of the 200-day EMA, while the Bank Nifty is trading above all key moving averages. However, traders and investors should remain cautious and keep an eye on key support and resistance levels, as well as broader market factors that could influence the trend.
In the current environment, it's essential to stay informed and adapt to changing market conditions. Whether you're a short-term trader or a long-term investor, understanding the technical indicators and market dynamics can help you make informed decisions and navigate the markets effectively. As always, risk management should be a top priority, and it's advisable to consult with a financial advisor before making any investment decisions.
Leave a Reply
Your email address will not be published. Required fields are marked *
lxbfYeaa
555
lxbfYeaa
555
lxbfYeaa
555
lxbfYeaa
555
lxbfYeaa
555
lxbfYeaa
555
lxbfYeaa
555
lxbfYeaa
5553U2rkvwR
lxbfYeaa
555
lxbfYeaa
-1 OR 5*5=25 --